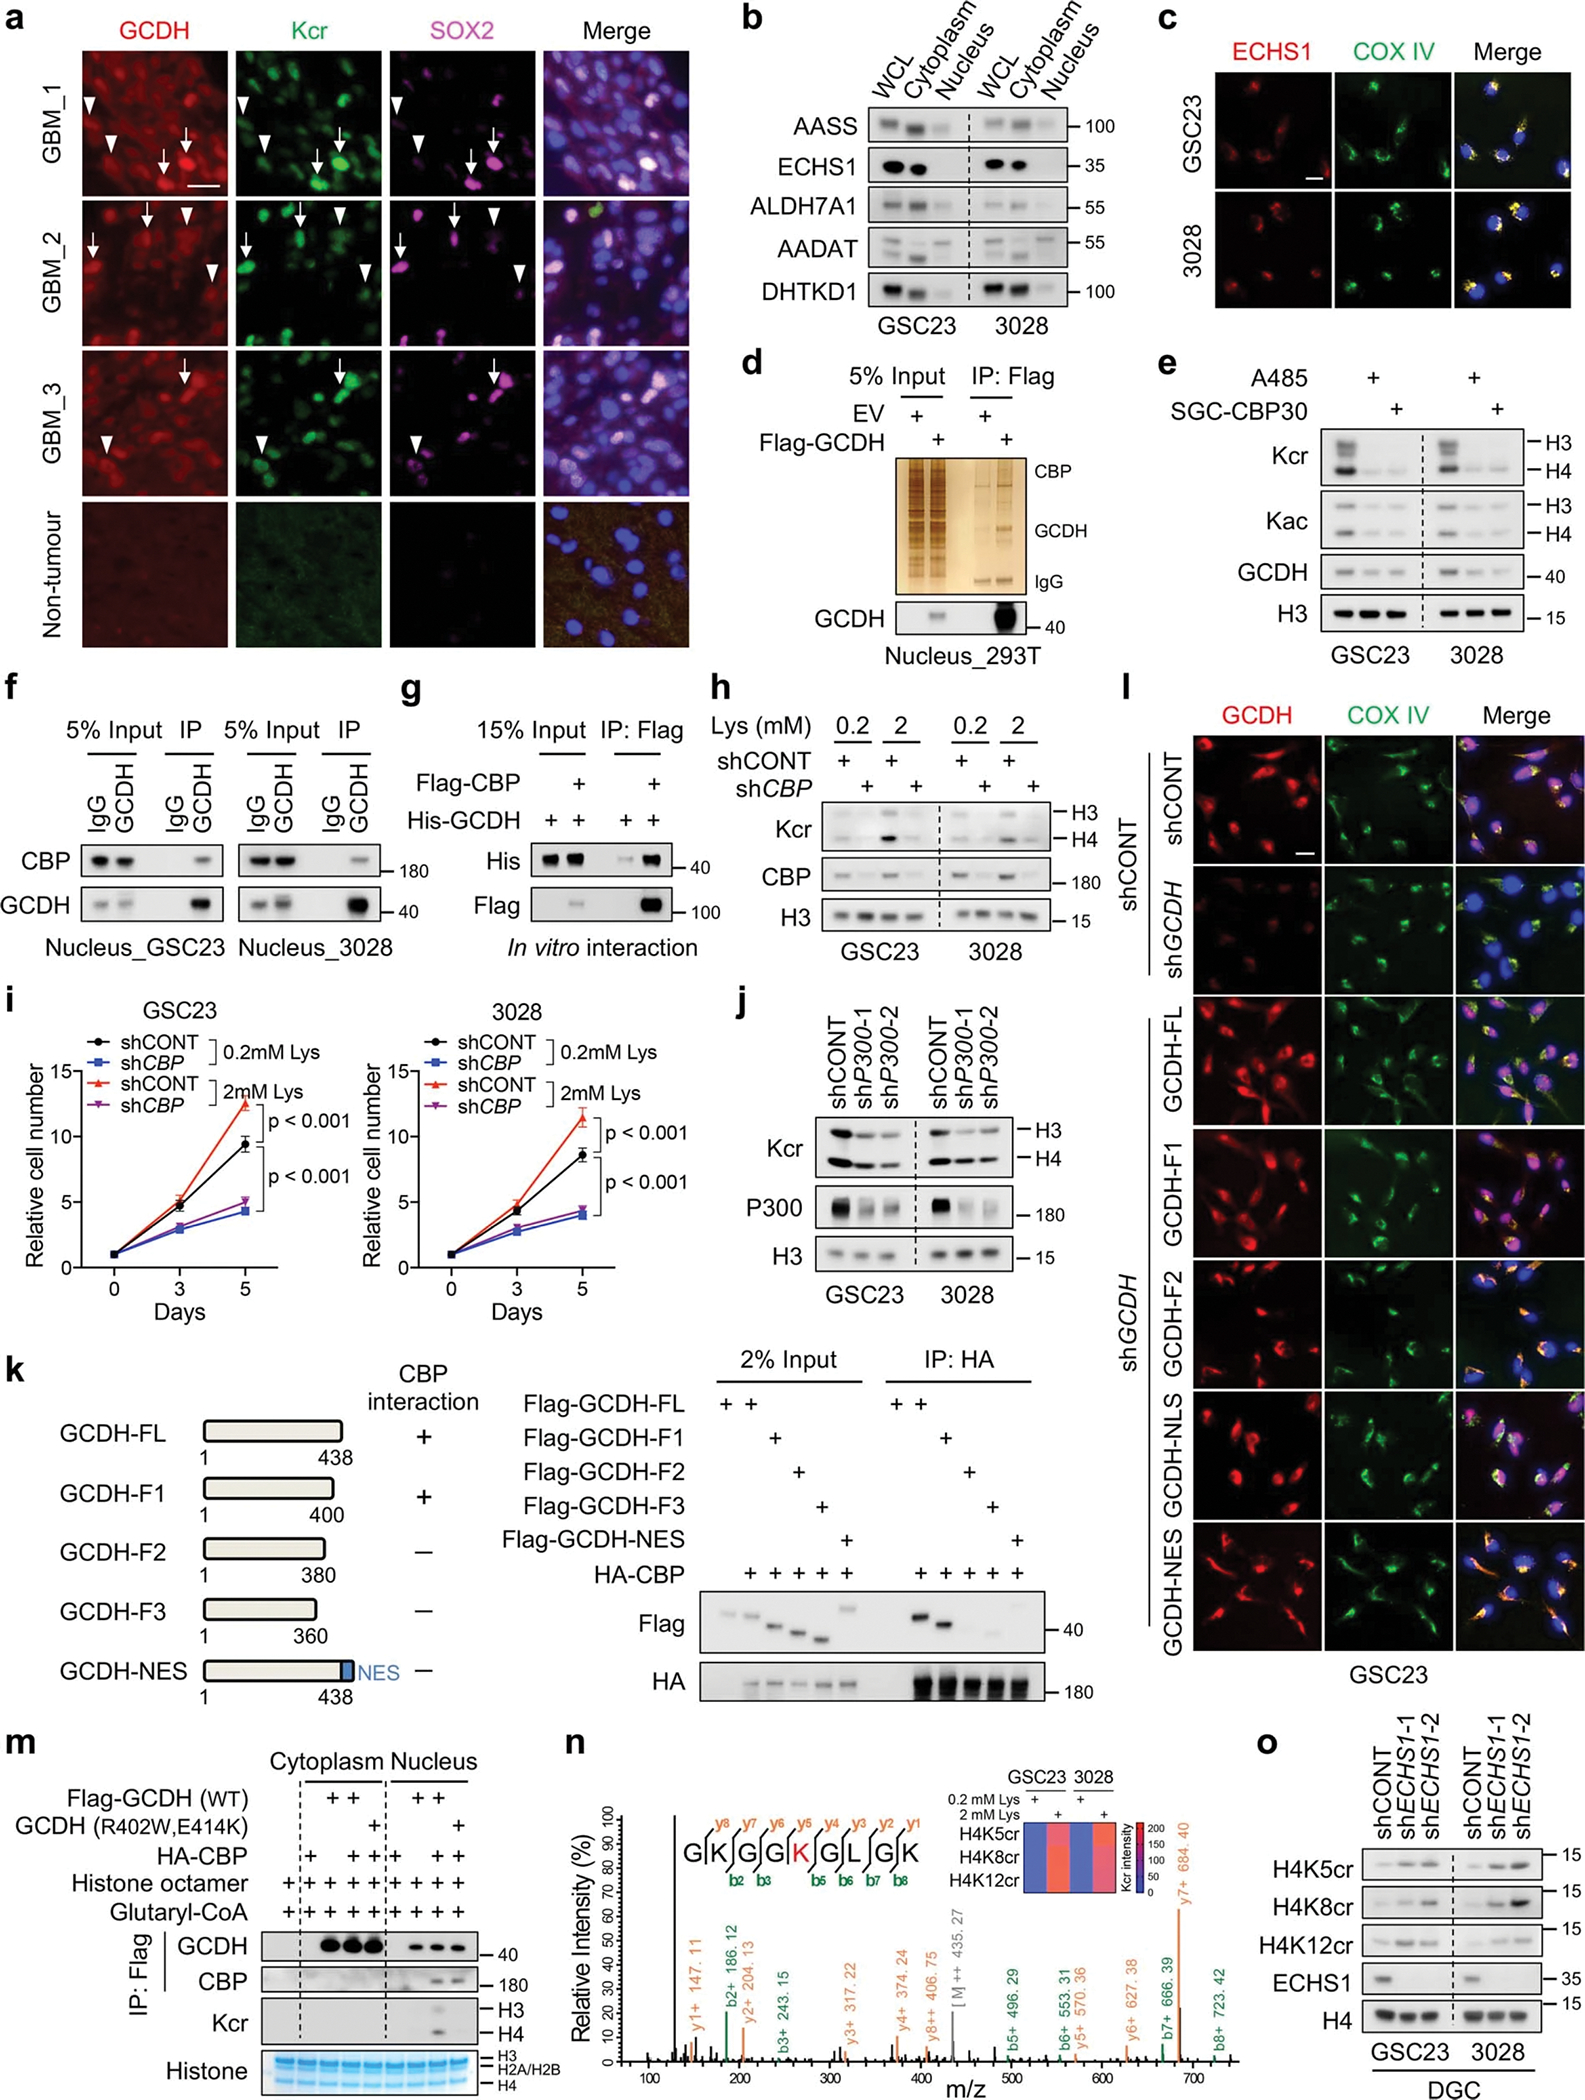
Extended Data Fig. 6. Nuclear-localized GCDH interacts with CBP to affect histone H4 Kcr.

a, IF staining of GCDH, Kcr and SOX2 in tumour (n = 3 biologically independent samples) and non-tumour brain tissues of GBM surgical specimens. Arrows, GSC-like tumour cells; arrowheads, differentiated tumour cells. Scale bar, 20 μm.
b, IB analysis of cytoplasmic and nuclear fractions of indicated proteins in GSCs.
c, IF staining of ECHS1 in GSCs. Scale bar, 20 μm.
d, IP-purified Flag-GCDH protein complex from the nuclear fraction of 293T cells was analysed by silver staining and IB.
e, IB analysis of GSCs treated with 1 μM A485 or 2 μM SGC-CBP30 for 3 days.
f, IB analysis of endogenous interaction between GCDH and CBP in the nuclei of GSCs.
g, In vitro interaction assay with recombinant GCDH and CBP proteins.
h, i, IB (h) and cell proliferation (i) of GSCs with or without CBP KD cultured in media with indicated concentrations of L-lysine.
j, IB analysis of Kcr in GSCs upon P300 KD.
k, IB analysis of IP in 293T cells co-transfected with the indicated plasmids. Summary of GCDH fragments used to interact with CBP is shown on the left.
l, IF staining of GCDH fragments in GSC23. Scale bar, 20 μm.
m, Nuclear GCDH complex crotonylates histone in vitro. Purified cytoplasmic or nuclear GCDH complexes from 293T cells transfected with indicated plasmids were incubated with histone octamer and glutaryl-CoA.
n, Representative MS spectrum of histone H4K8 crotonylated peptide from GSC23 cultured in media with 2 mM L-lysine. Heatmap summarizes the quantification of crotonylation signals at H4K5, H4K8 and H4K12 in GSCs.
o, IB analysis of H4 Kcr in DGCs with or without ECHS1 KD.
Representative of two independent experiments in a-h, j-m and o. Data are presented as mean ± SEM from three independent experiments in i. Two-way ANOVA followed by multiple comparisons with adjusted p values for i.
