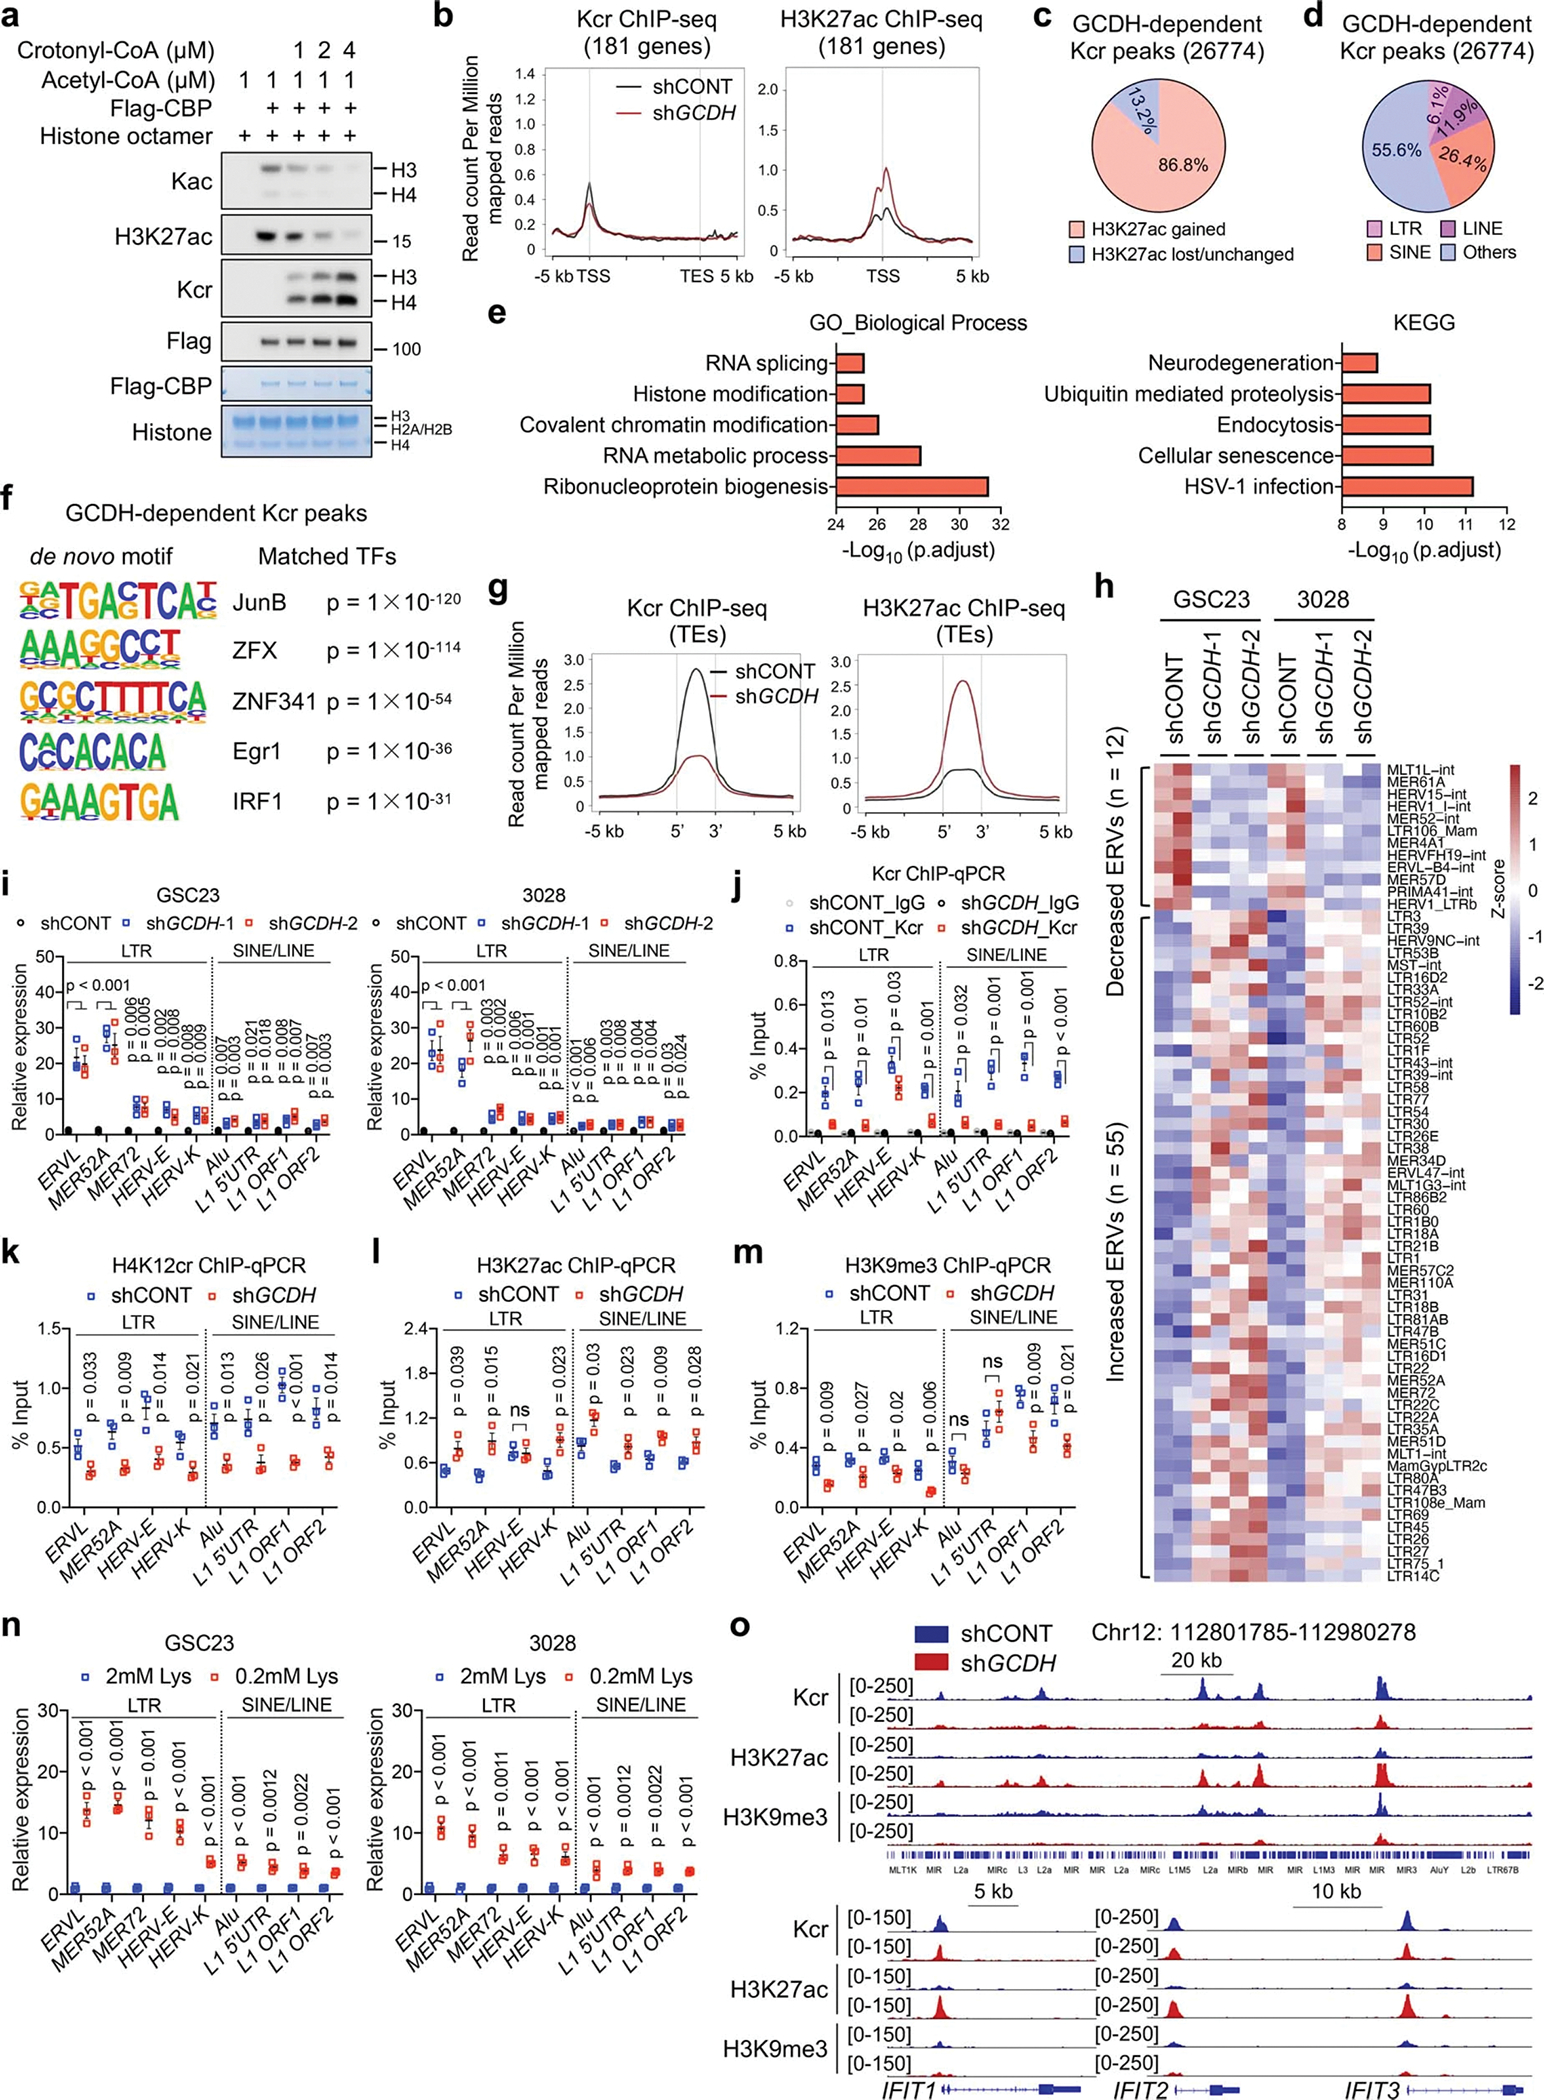
Extended Data Fig. 8. Histone Kcr governs retrotransposon expression by remodelling the chromatin landscape.

a, IB analysis of Kac and Kcr by in vitro acetylation and crotonylation assays.
b, Kcr and H3K27ac ChIP-seq signals at genomic loci of lysine catabolism-repressed genes in control and GCDH KD GSC23.
c, Pie charts showing proportions of increased and lost/unchanged H3K27ac signals within GCDH-dependent Kcr peaks after GCDH loss.
d, Percentages of TEs (LTRs, LINEs and SINEs) in GCDH-dependent Kcr peaks.
e, GO and KEGG analysis of GCDH-dependent Kcr occupied genes, ranked by adjusted p values.
f, Motif sequences (left) and 5 best matched TFs with corresponding p value (right) from de novo motif analysis of GCDH-dependent Kcr peaks.
g, Tag density of Kcr and H3K27ac profiles on TEs (LTRs, LINEs and SINEs) upon GCDH loss.
h, Heatmap summarizing the differential transcript expression of LTR-containing ERVs from multiple genomic loci between control and GCDH KD GSCs.
i-n, RT-qPCR (i, n) and ChIP-qPCR (j-m) analyses of representative TEs with primers that detected overall levels of the corresponding TE subfamilies from multiple genomic loci. Data are presented as mean ± SEM from three independent experiments. Two-tailed unpaired t test was used for statistical analysis. ns, not significant.
o, Genome browser snapshots of Kcr, H3K27ac and H3K9me3 signals at indicated genomic loci of TEs (upper panel) and ISGs (bottom panel) from control and GCDH KD GSC23.
