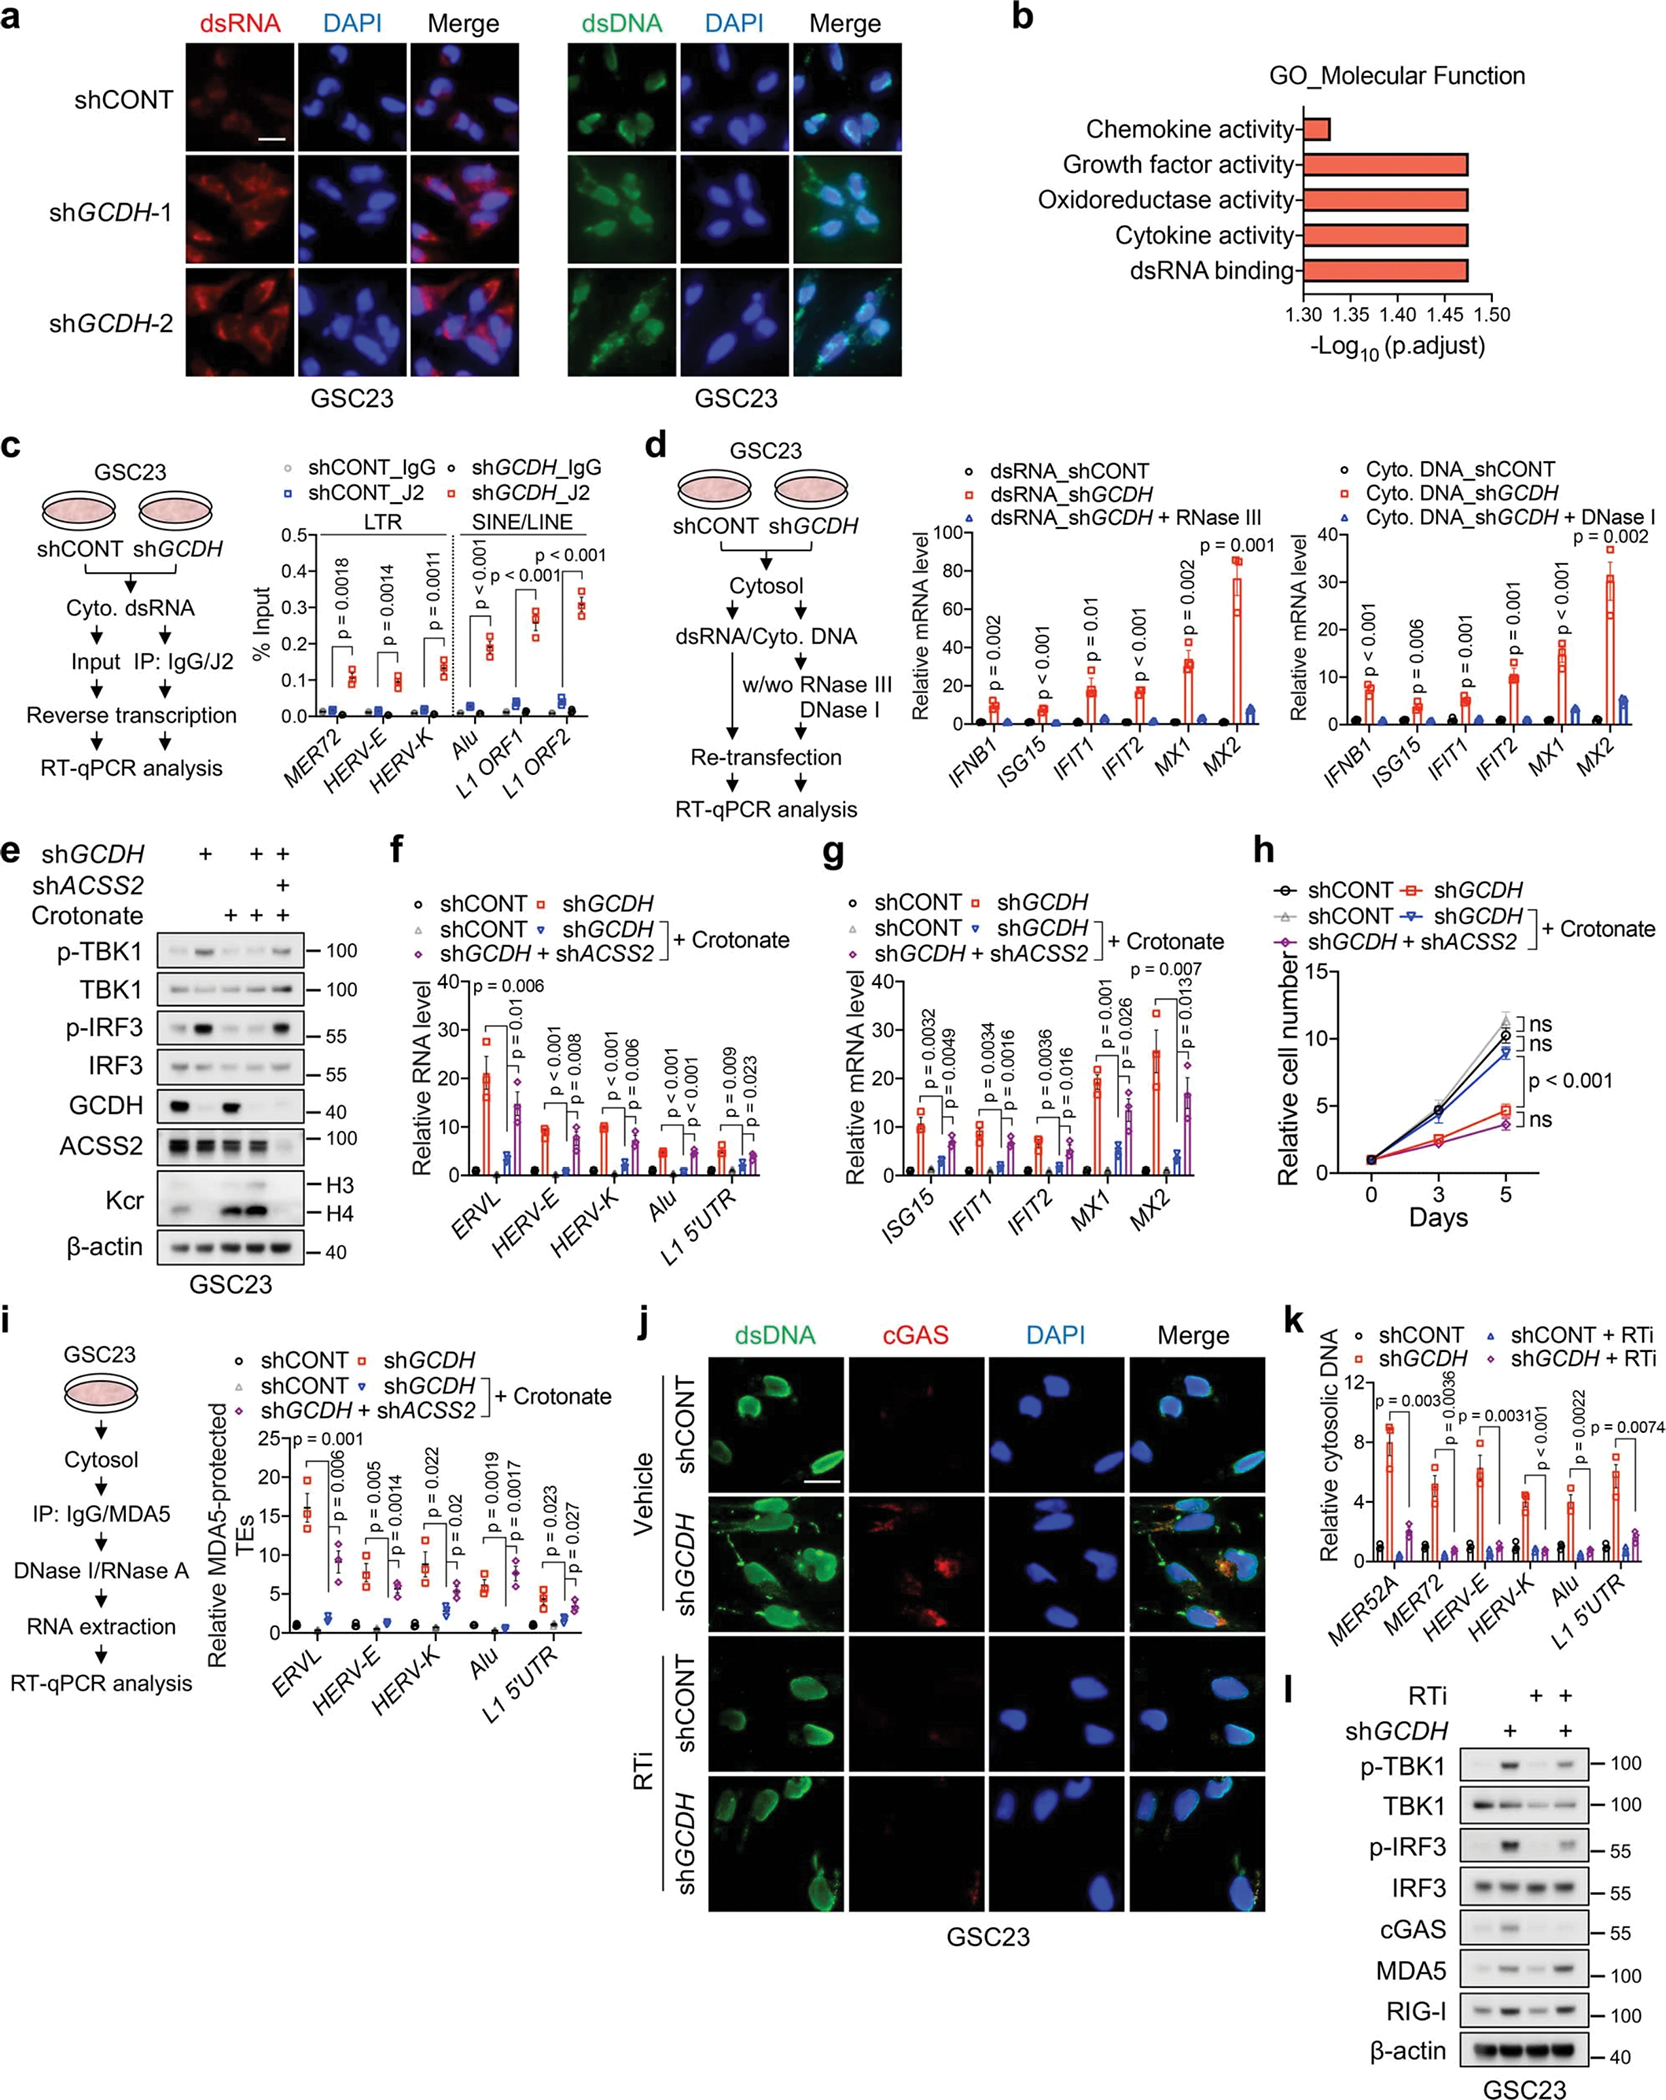
Extended Data Fig. 9. Retrotransposons boost IFN signalling through cytosolic dsRNA and dsDNA sensing pathways.

a, IF staining of dsRNA (left panels) and dsDNA (right panels) in GSC23 with or without GCDH KD. Scale bar, 20 μm.
b, GO enrichment analysis of 308 upregulated genes upon GCDH KD in two GSCs, ranked by adjusted p values.
c, RT-qPCR analysis of indicated retrotransposon transcripts captured by dsRNA-specific antibody (J2) in pulldown assay. Protocol is shown on the left.
d, RT-qPCR analysis of ISGs in GSC23 transfected with cytosolic dsRNA or DNA.
e-h, IB (e), RT-qPCR analysis of representative TEs (f) and ISGs (g), and cell proliferation (h) of GSC23 with indicated gene depletion or 2mM crotonate supplementation in culture media for 5 days.
i, RT-qPCR analysis of representative TEs in MDA5-protected fractions after indicated gene depletion or 2mM crotonate supplementation in culture media for 5 days in GSC23.
j-l, IF staining (j), qPCR analysis of TEs in cytosolic DNA (k) and IB analysis (l) of control and GCDH KD GSC23 treated with or without a reverse transcriptase inhibitor (RTi, 10 μM) for 48 h. Each TE level in cytosolic DNA was normalized to its expression in DNA isolated from nuclear lysate and control group. Scale bar, 20 μm.
Representative of two independent experiments in a, e, j and l. Data are presented as mean ± SEM from three independent experiments in c, d, f-i and k. One-way ANOVA followed by multiple comparisons with adjusted p values for c, d, f, g, i and k, two-way ANOVA followed by multiple comparisons with adjusted p values for h. ns, not significant.
