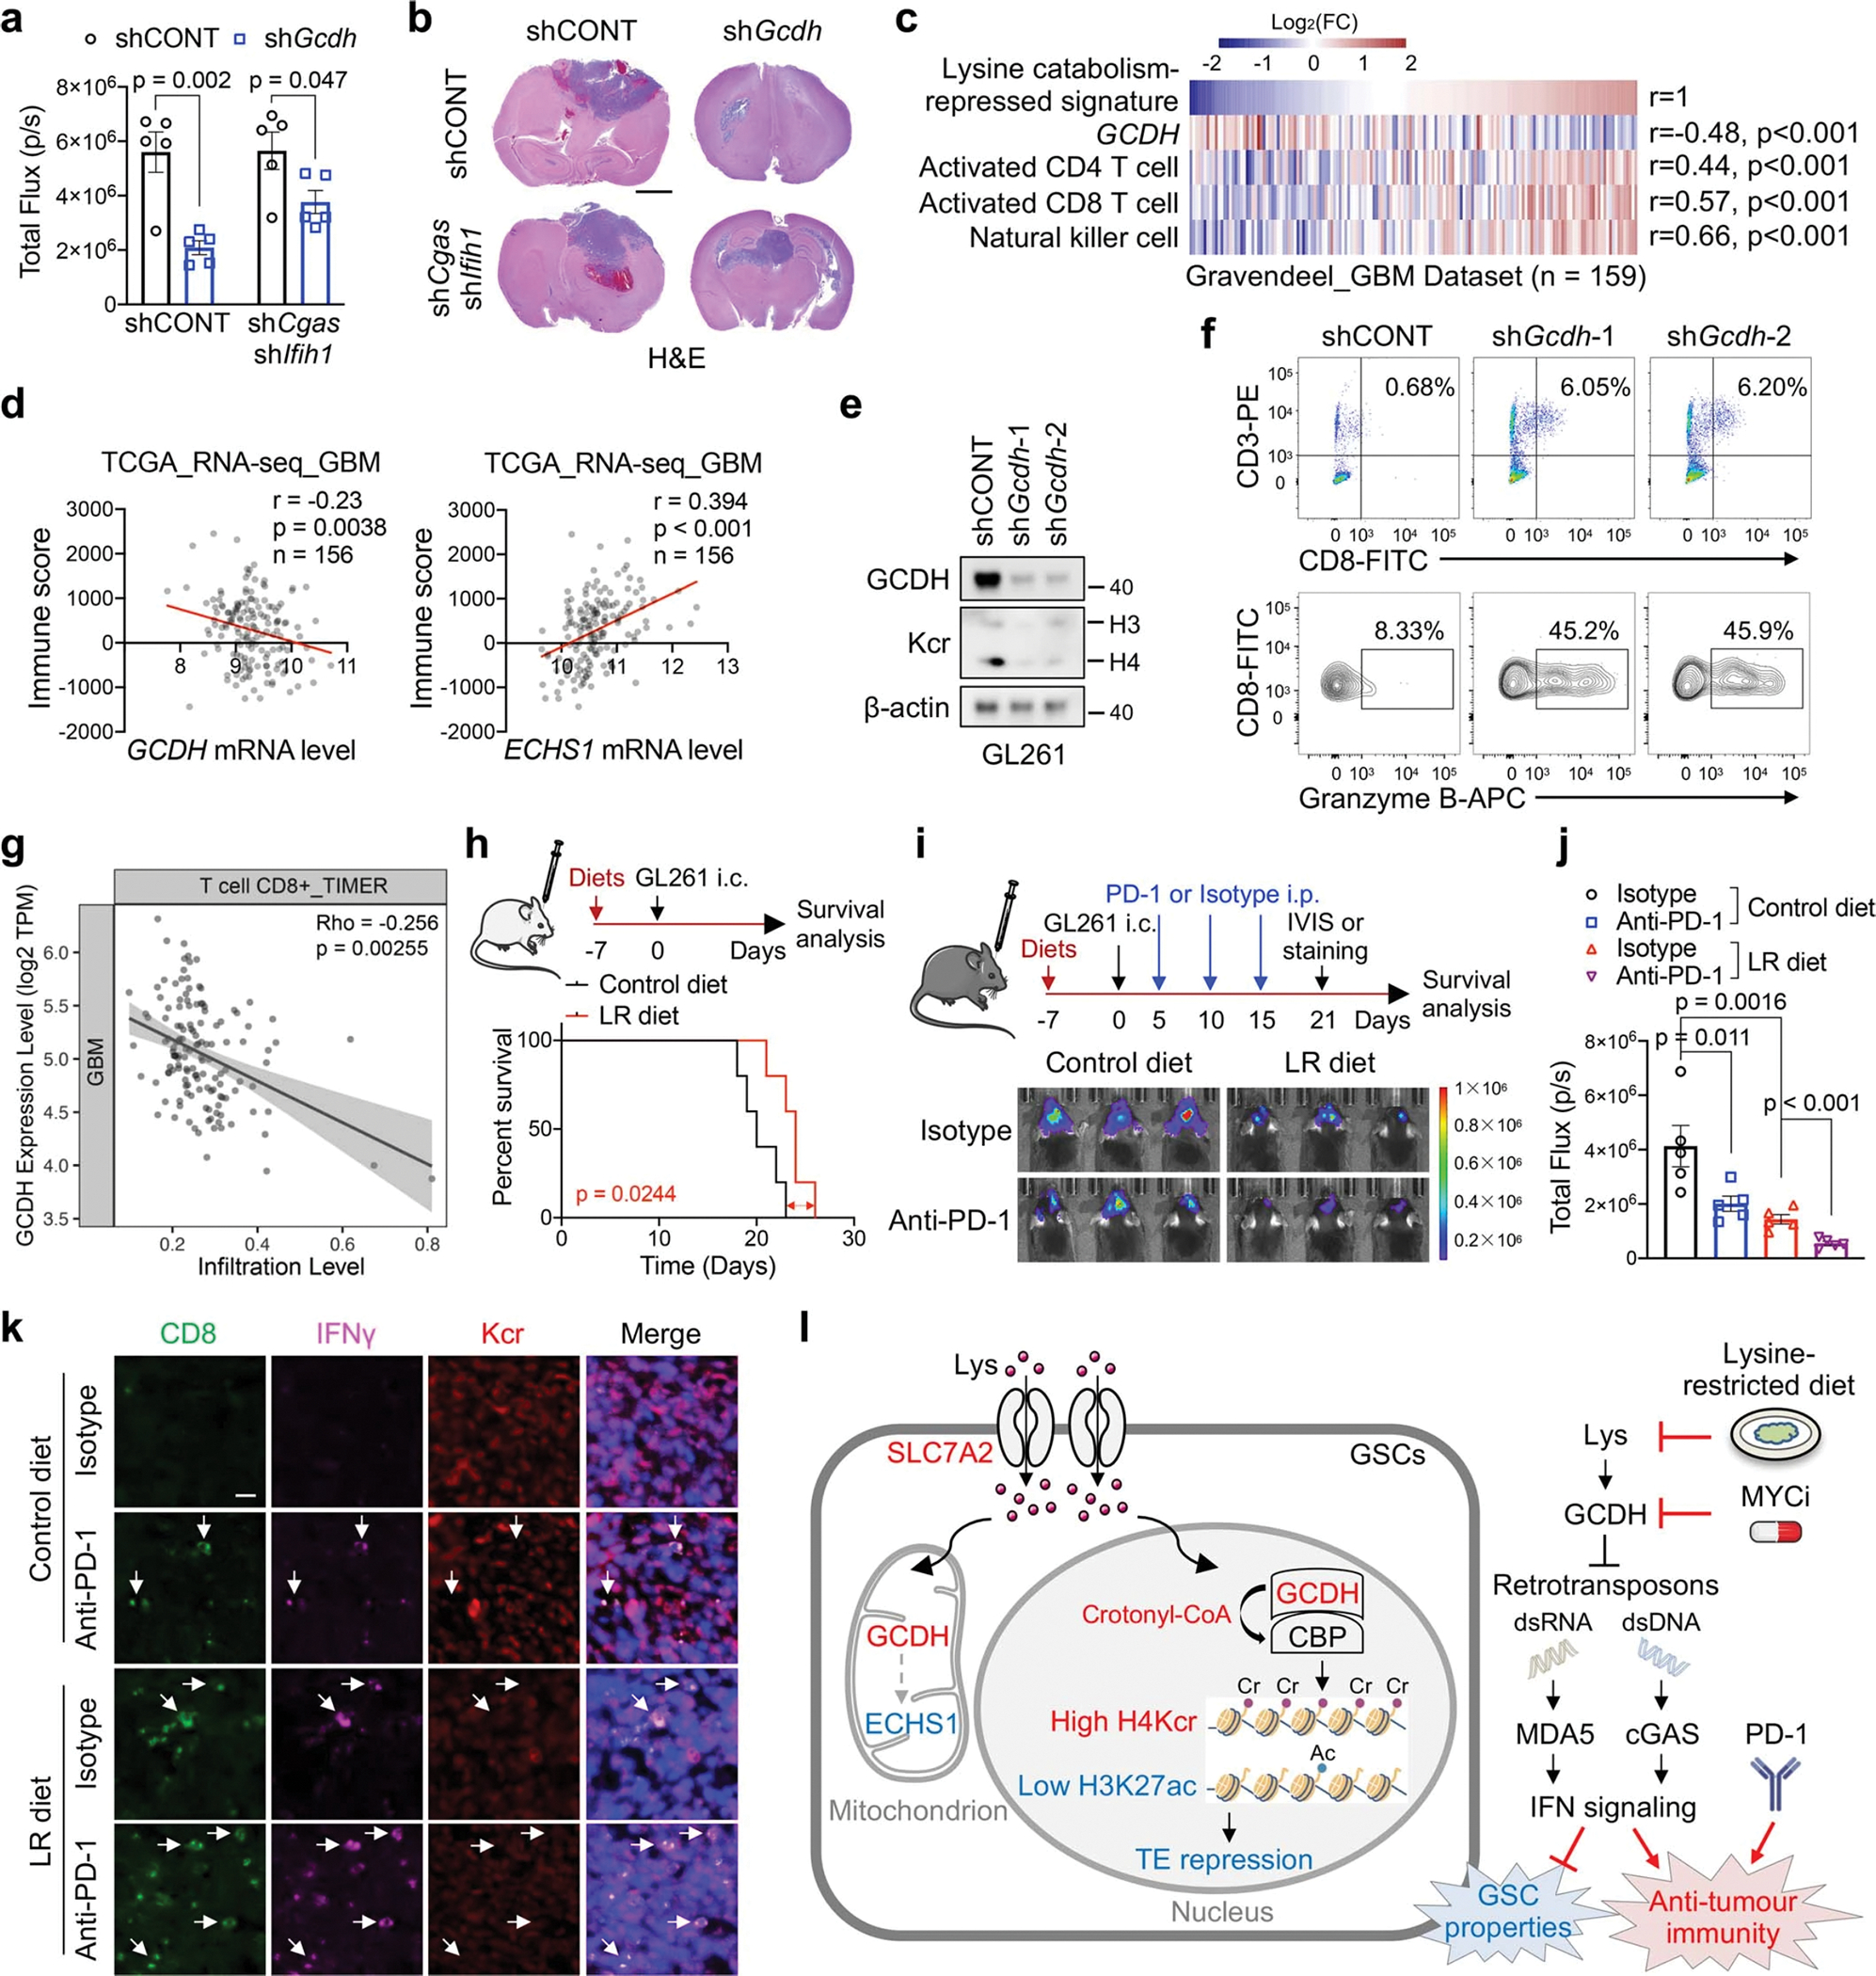
Extended Data Fig. 10. Lysine catabolism disruption enhances tumour immunogenicity.

a, b, Quantification of in vivo bioluminescence imaging (n = 5 biologically independent mice, a) and H&E-stained coronal sections (b) of immunocompetent mice bearing GL261-derived intracranial tumours at 3 weeks. Scale bar, 2 mm.
c, Correlations between lysine catabolism-repressed signature, GCDH mRNA level, activated CD4 T cell, activated CD8 T cell and NK cell in GBM dataset.
d, Correlation of GCDH, ECHS1 mRNA levels and immune scores based on ESTIMATE algorithm in TCGA GBM dataset.
e, IB analysis of Kcr in GL261 upon Gcdh KD.
f, Flow cytometric analysis of CD8+ T cells (upper panel) and Granzyme B+ CD8+ T cells (bottom panel) in GL261-derived intracranial tumours at day 14 post-injection.
g, Scatter plots showing the correlation between GCDH expression levels and CD8+ T cell infiltration scores in TCGA GBM dataset from TIMER database. The gray area indicates 95 % confidence interval for the regression line.
h, Kaplan-Meier survival plots of immunodeficient mice bearing GL261-derived intracranial tumours fed control or LR diet starting at 7 days before transplantation (n = 5).
i, j, In vivo bioluminescence imaging (i) and quantification of total flux (n = 5 biologically independent mice, j) of immunocompetent mice bearing GL261-derived intracranial tumours with anti-PD-1, LR diet or the combination treatment.
k, IF staining for CD8, IFNγ and Kcr in indicated sections (n = 3 biologically independent mice). Scale bar, 20 μm.
l, A working model showing that disruption of reprogrammed lysine catabolism-derived histone Kcr suppresses GSC maintenance and induces anti-tumour immune response by promoting immunogenic retroelements and IFN signalling.
Representative of two independent experiments in e. In a and j, data are presented as mean ± SEM. Two-tailed unpaired t test for a, Pearson’s correlation with two-tailed test for c and d, Spearman’s Rho with two-tailed test was used for g, log-rank test for h, one-way ANOVA followed by multiple comparisons with adjusted p values for j.
