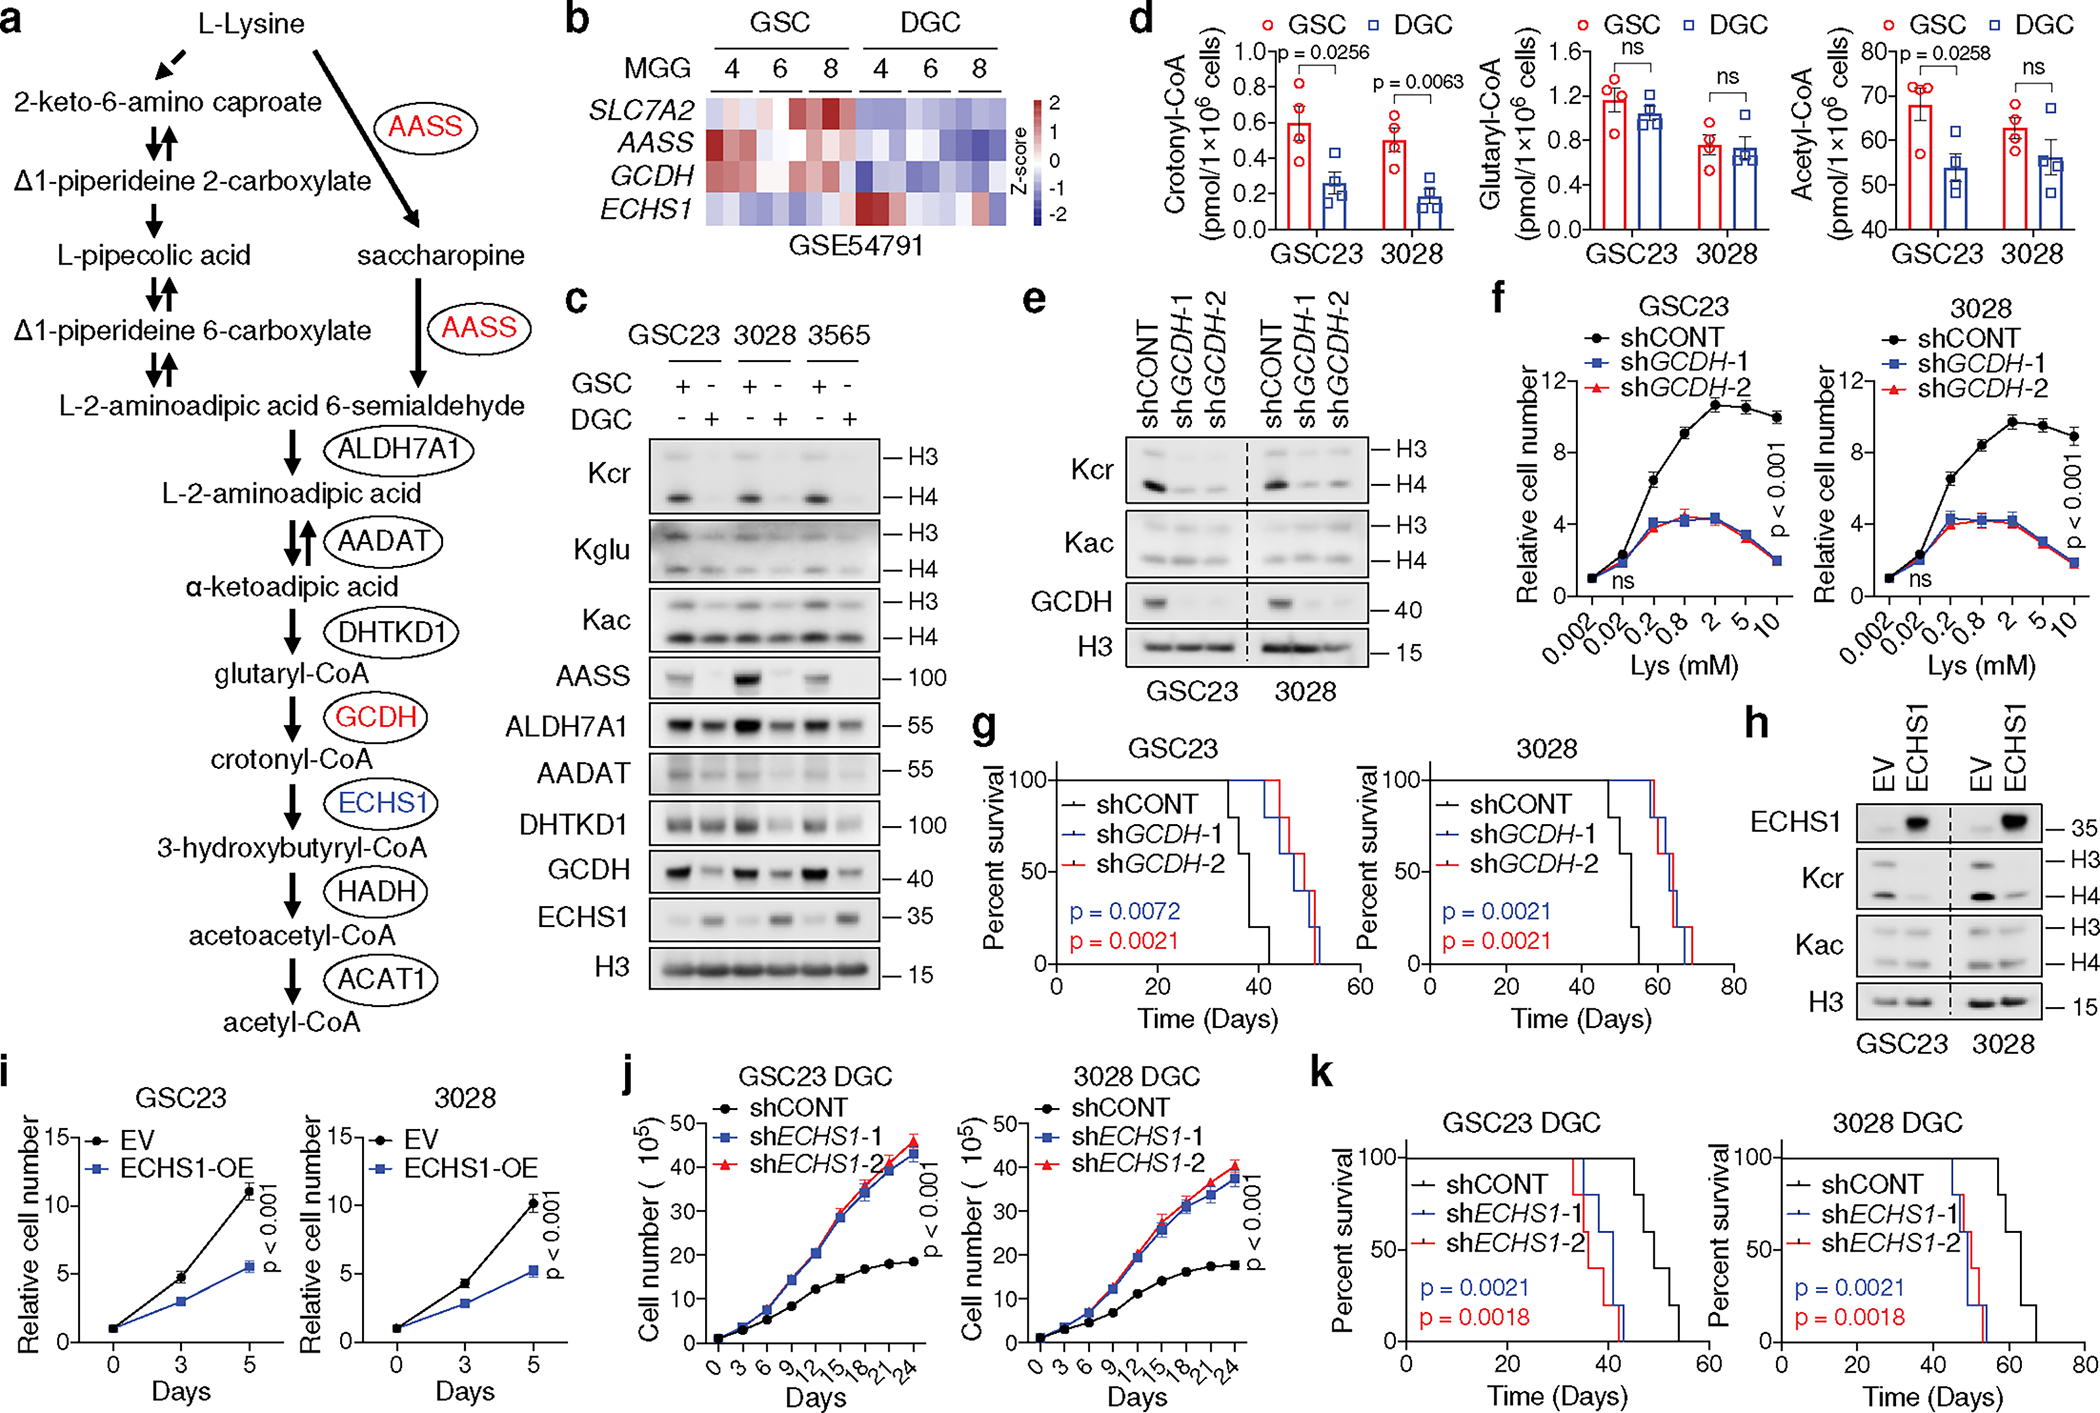
Fig. 2. GSCs reprogram lysine catabolism to promote Kcr and tumourigenesis.

a, Diagram showing lysine catabolism pathway.
b, Heatmap summarizing gene expression in matched GSCs and DGCs.
c, IB analysis of matched GSCs and DGCs.
d, Intracellular acyl-CoAs (n = 4 biologically independent samples) in GSCs and DGCs.
e, IB analysis of GSCs cultured in typical media.
f, Relative cell number of two GSCs with or without GCDH KD cultured in media with increasing doses of L-lysine for 5 days.
g, Kaplan-Meier survival plots of immunocompromised mice as indicated (n = 5).
h, i, IB (h) and cell proliferation (i) of two GSCs with or without ECHS1 overexpression.
j, Cumulative cell number of two DGCs with or without ECHS1 KD.
k, Kaplan-Meier survival plots of immunocompromised mice as indicated (n = 5). Representative of two independent experiments in c, e and h. Data are presented from three independent experiments in f, i and j. Data are presented as mean ± SEM in d, f, i and j. Two-tailed unpaired t test for d, two-way ANOVA followed by multiple comparisons with adjusted p values for f, i and j, log-rank test for g and k. ns, not significant.
