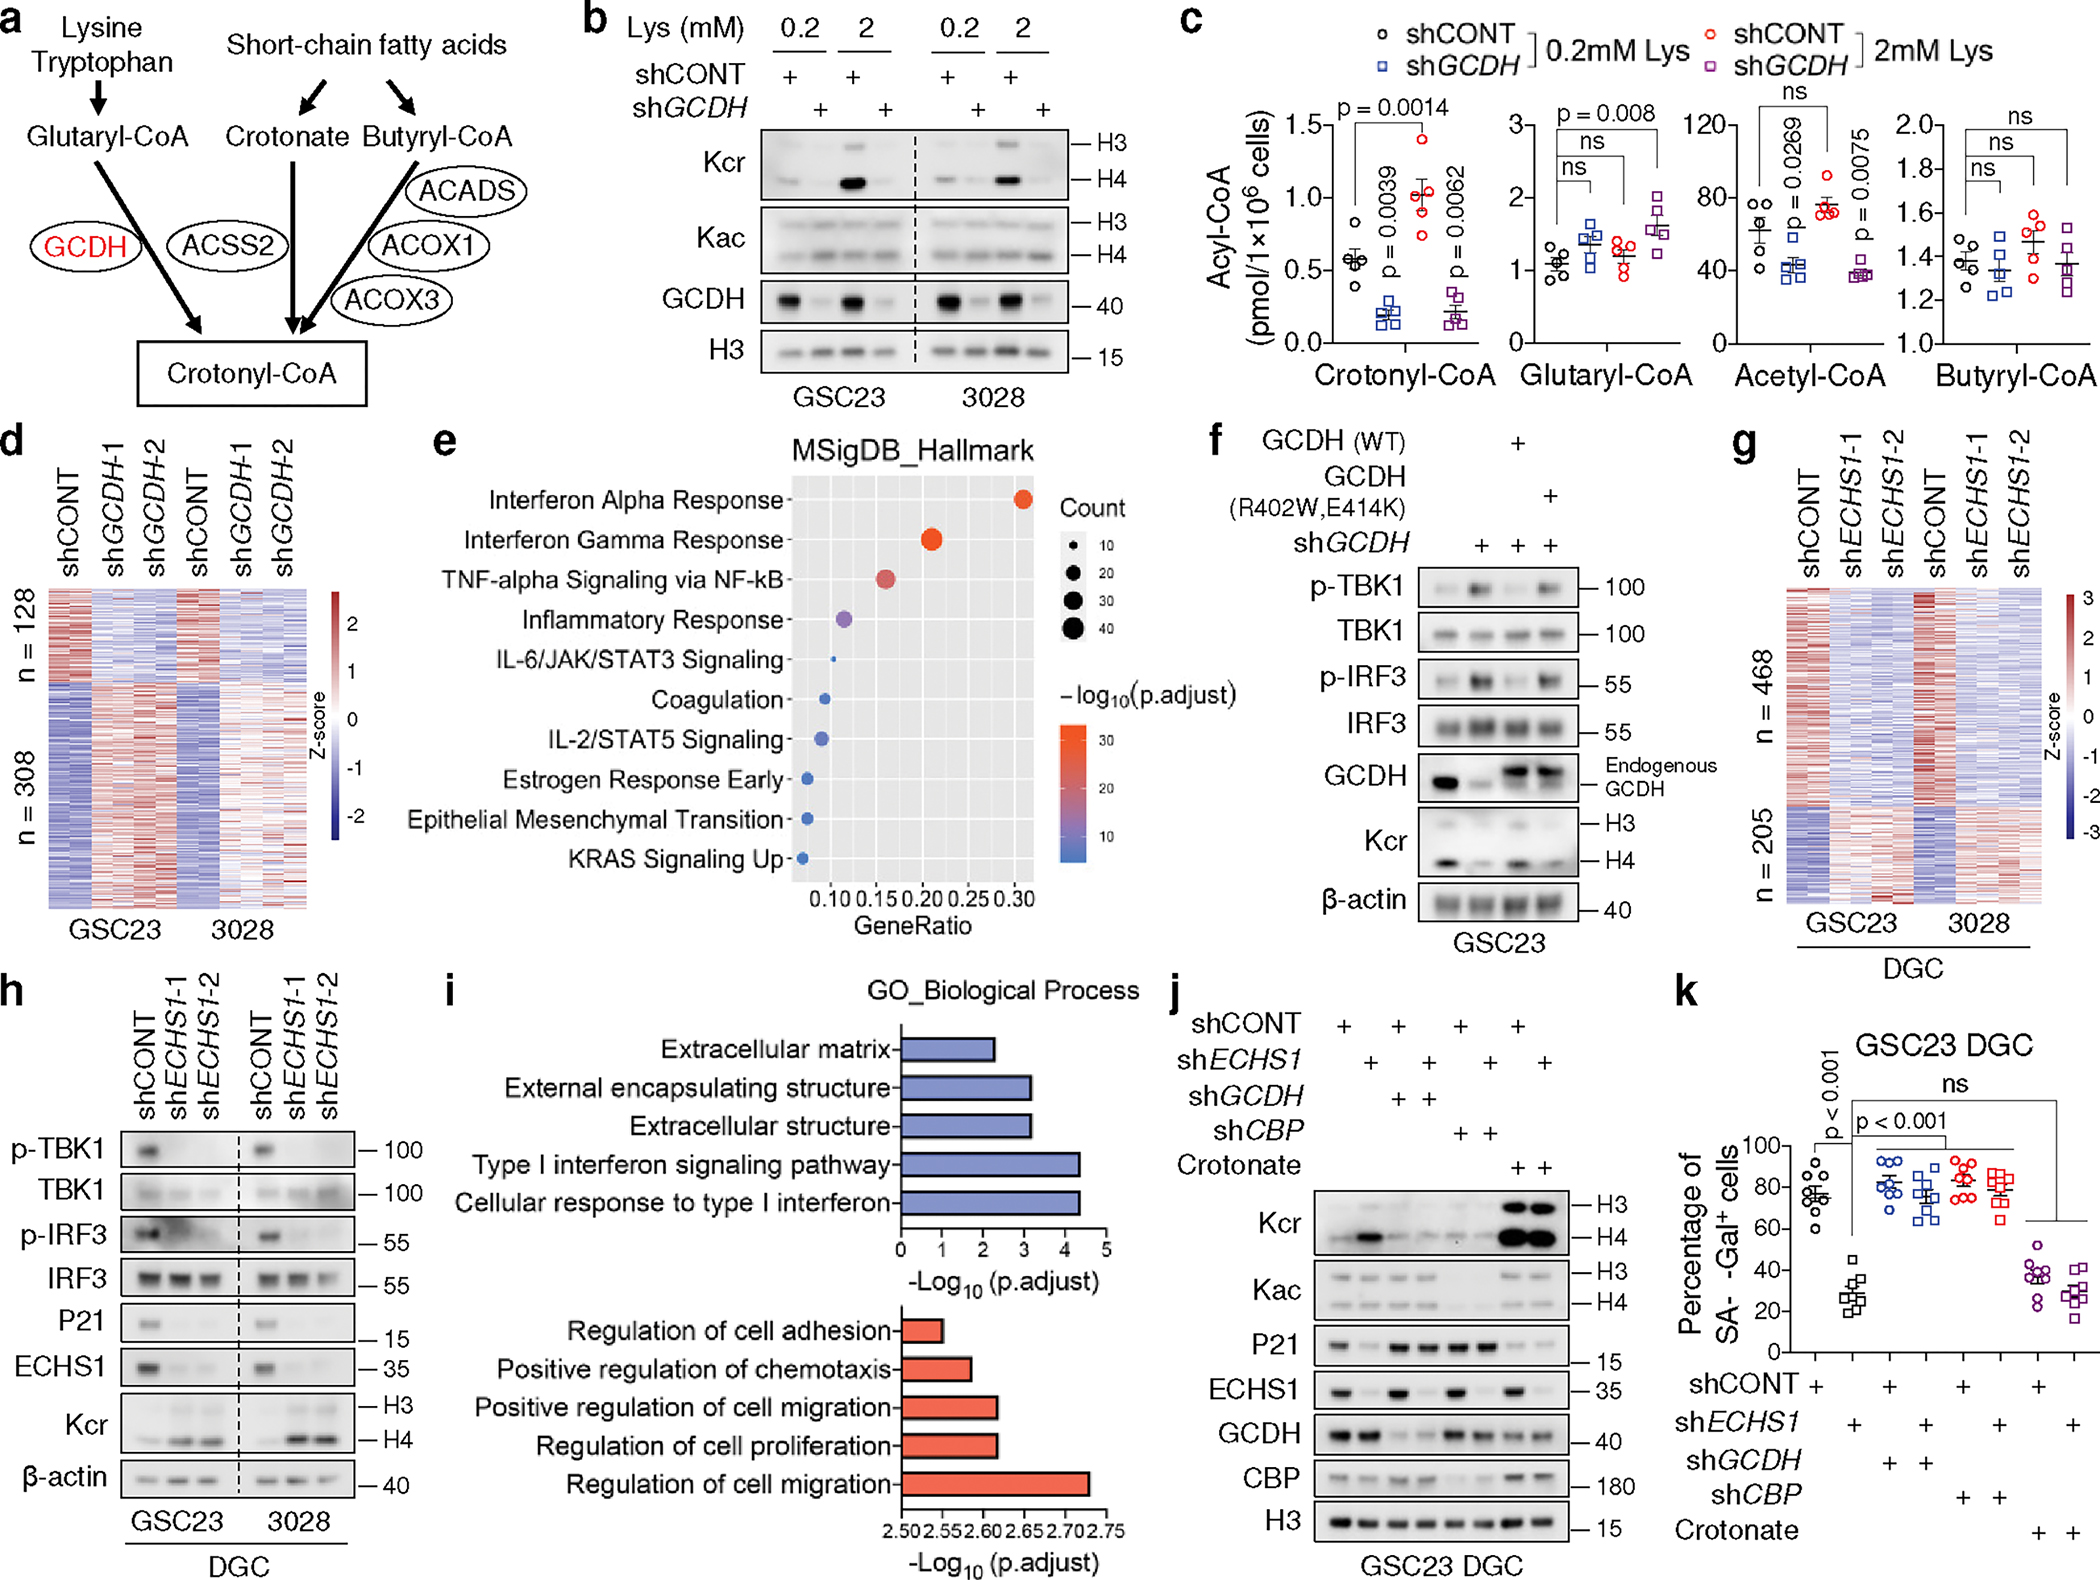
Fig. 3. Perturbation of lysine catabolism affects type I IFN signalling.

a, Key metabolic pathways that produce crotonyl-CoA. Red, upregulation.
b, c, IB (b) and intracellular acyl-CoAs (n = 5 biologically independent samples from GSC23, c) of control and GCDH KD GSCs cultured in media with indicated concentrations of L-lysine.
d, Heatmap summarizing DEGs upon GCDH KD in two GSCs.
e, Dot plot summarizing top 10 signalling pathways enriched in the upregulated genes upon GCDH KD in GSCs, ranked by adjusted p values.
f, IB analysis of control and 3’UTR-targeted shGCDH GSC23 with or without ectopic expression of WT, GCDH enzymatic mutant (R402W, E414K).
g, Heatmap summarizing DEGs upon ECHS1 KD in two early-passage DGCs.
h, IB analysis of two DGCs with or without ECHS1 KD.
i, GO enrichment analysis of downregulated (blue) and upregulated (red) genes upon ECHS1 KD in two DGCs, ranked by adjusted p values.
j, k, IB (j) and SA-β-Gal+ percentage (k) of DGCs with indicated gene depletion or 2mM crotonate supplementation in culture media for 1 week.
Representative of two independent experiments in b, f, h and j. Data are presented from three independent experiments in k. In c and k, data are presented as mean ± SEM. One-way ANOVA followed by multiple comparisons with adjusted p values for c and k. ns, not significant.
