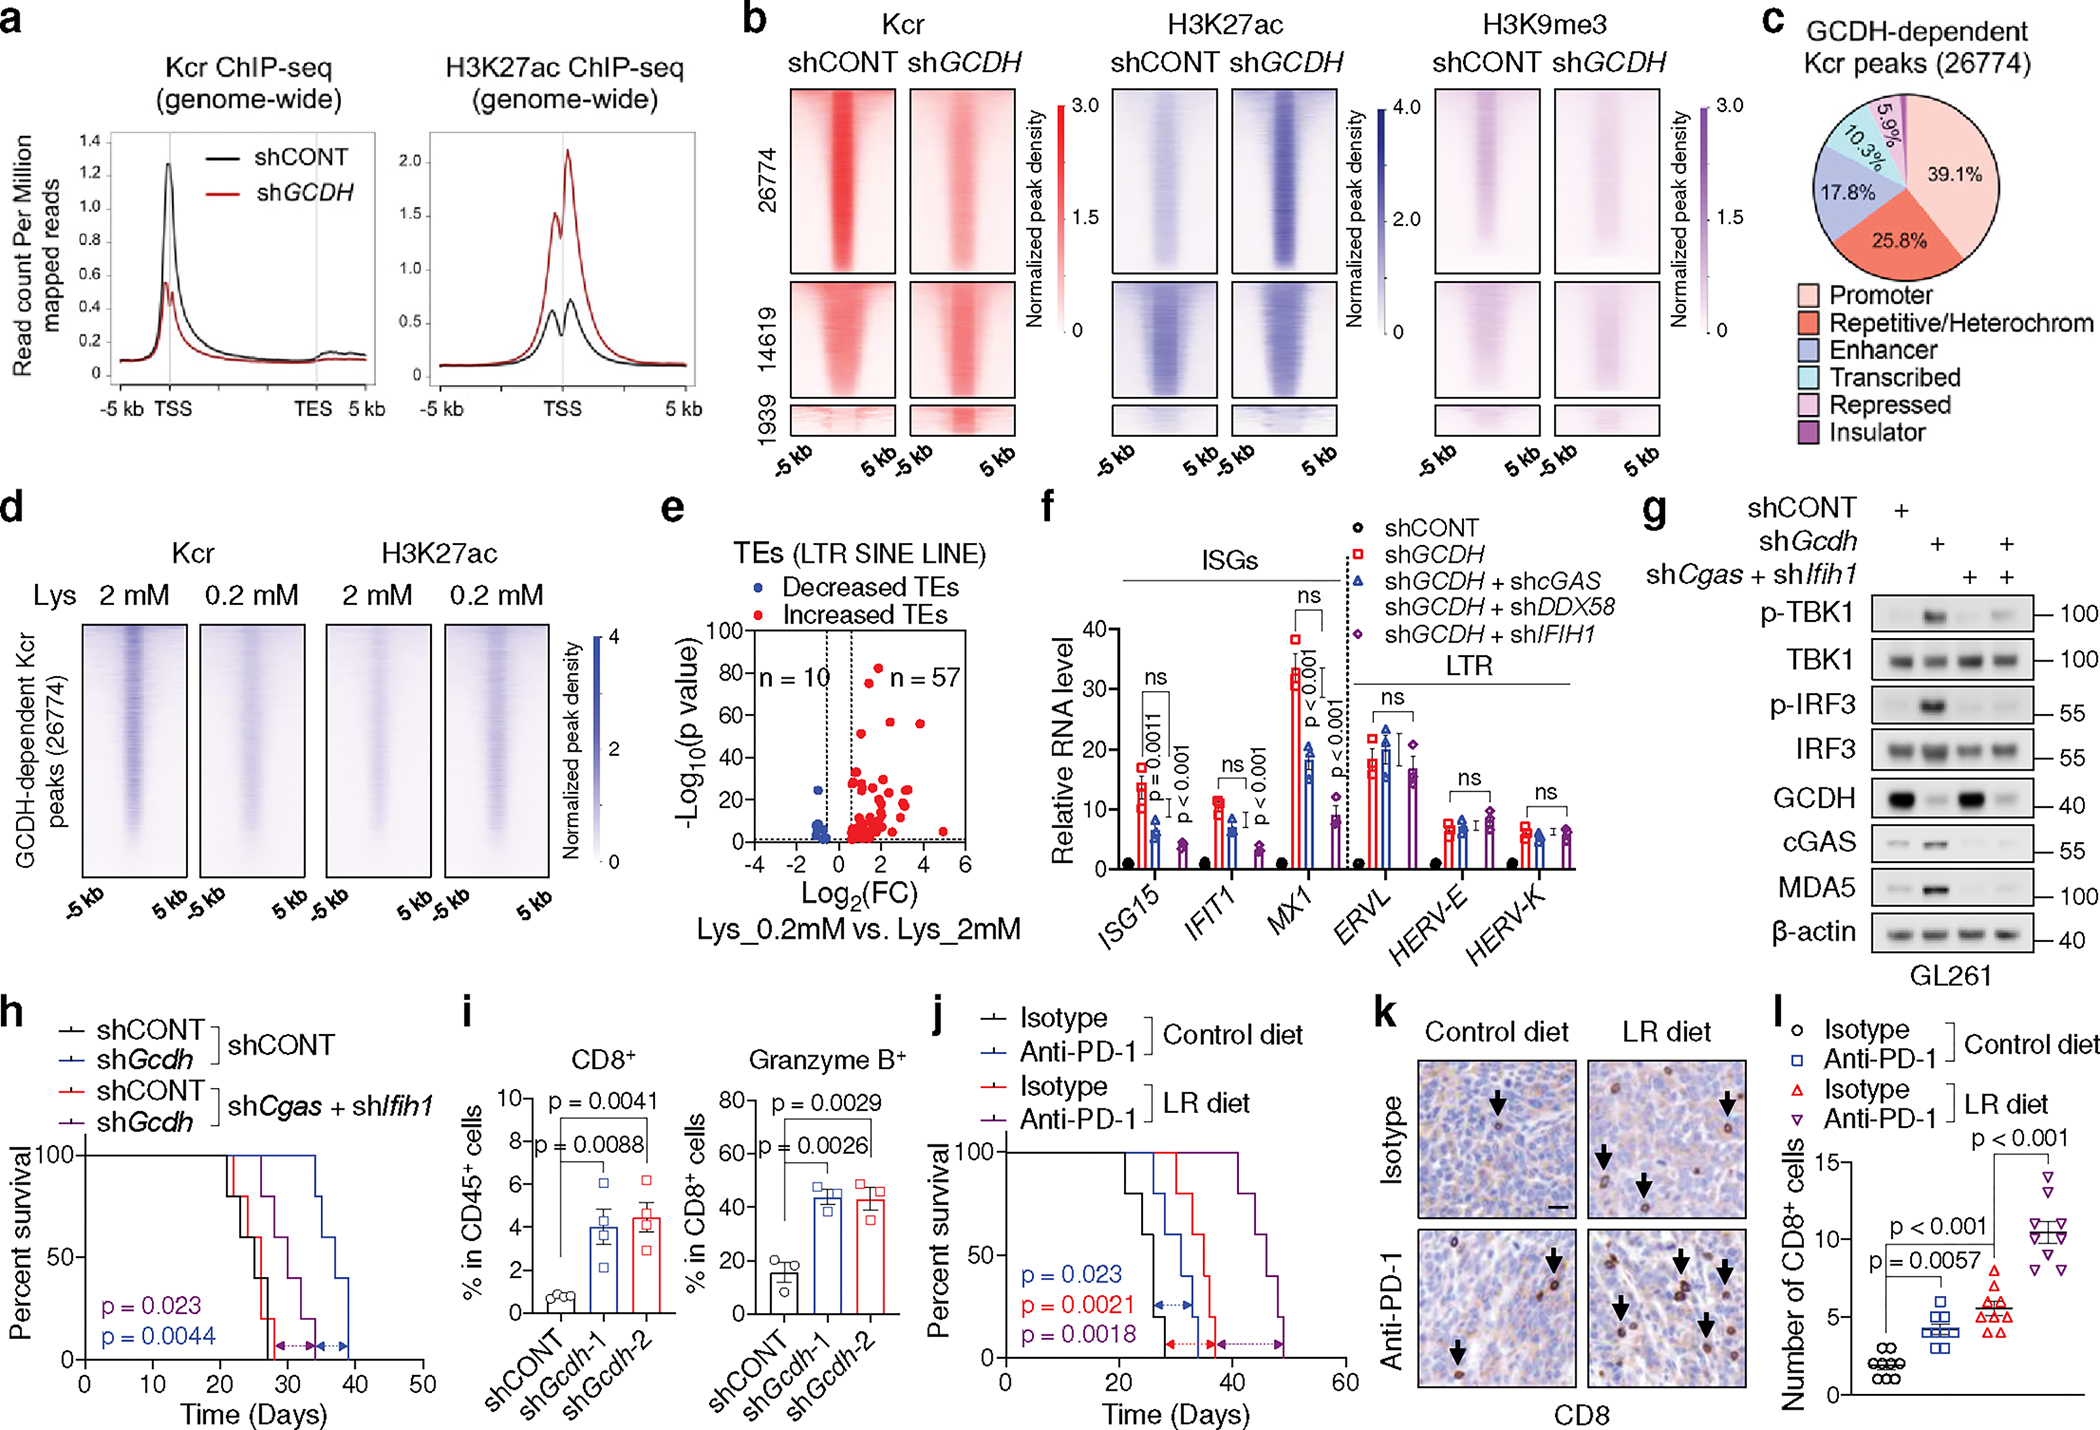
Fig. 5. Lysine catabolism disruption stimulates anti-tumour immunity via immunogenic retrotransposons.

a, Genome-wide profiles of Kcr and H3K27ac in control and GCDH KD GSC23.
b, Heatmaps of Kcr, H3K27ac and H3K9me3 ChIP-seq signals sorted by differential Kcr peaks between control and GCDH KD GSC23. 26774 peaks exhibited reduced Kcr signals upon GCDH loss were named as GCDH-dependent Kcr peaks.
c, Genomic annotations of GCDH-dependent Kcr peaks by chromosome features.
d, Heatmaps of Kcr and H3K27ac ChIP-seq signals within GCDH-dependent Kcr peaks in GSC23 cultured in media with indicated concentrations of L-lysine.
e, Volcano plot showing transcript levels of TEs in GSCs cultured with 0.2 mM L-lysine versus 2 mM L-lysine, defined by adjusted p < 0.05 and fold change > 1.5.
f, RT-qPCR analysis of representative ISGs and LTR-containing ERVs in GSC23.
g, IB analysis in control and Gcdh KD GL261 with or without Cgas and Ifih1 KD.
h, Kaplan-Meier survival curves of immunocompetent mice bearing GL261-derived intracranial tumours (n = 5).
i, Flow cytometric analysis of CD8+ T cells (n = 4 biologically independent mice) and Granzyme B+ CD8+ T cells (n = 3 biologically independent mice) in GL261-derived intracranial tumours at day 14 post-injection.
j, Kaplan-Meier survival curves of immunocompetent mice bearing GL261-derived intracranial tumours (n = 5).
k, l, Representative IHC staining (k) and quantification (n = 3 biologically independent mice, l) of CD8+ T cells from indicated tumours at day 21 post-transplantation. Scale bar, 20 μm.
Data are presented from three independent experiments in f. Representative of two independent experiments for g. In f, i and l, data are presented as mean ± SEM. One-way ANOVA followed by multiple comparisons with adjusted p values for f, i and l, log-rank test for h and j. ns, not significant.
