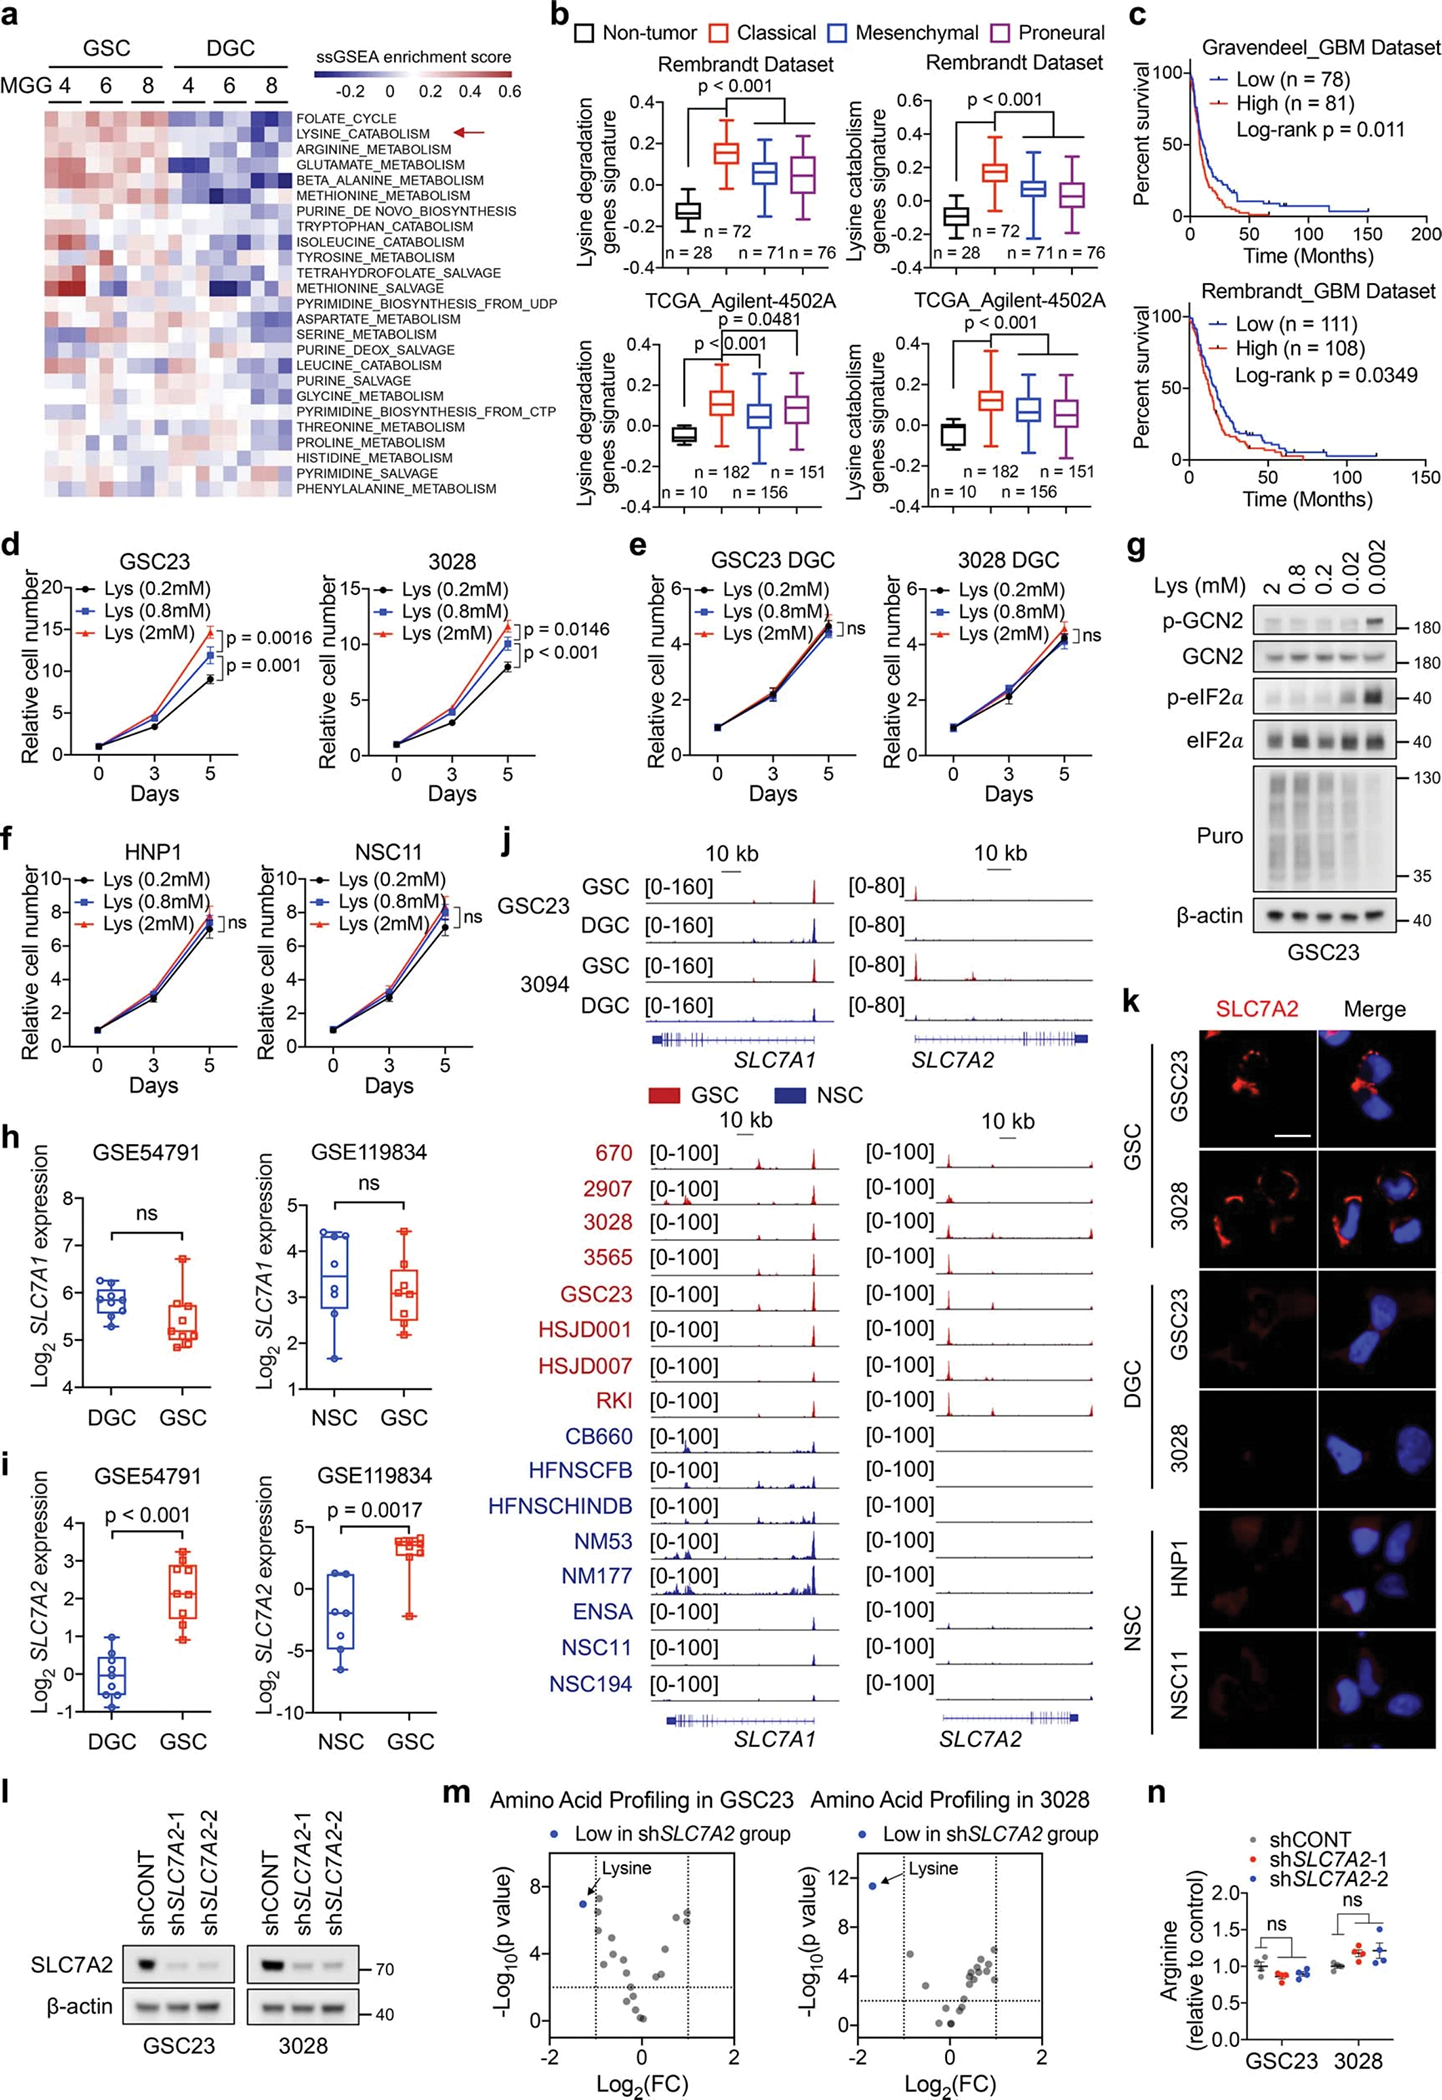
Extended Data Fig. 1. SLC7A2 augments lysine consumption to support GSC function.

a, ssGSEA of metabolic gene sets from BioCyc database in three GSCs and matched DGCs. Each cell contains 3 replicates from GSE54791.
b, Box plots comparing lysine catabolic activity defined by corresponding gene set signatures in non-tumour brain tissue and three subtypes of GBM across two datasets from GlioVis. Boxes represent data within the 25-to-75 percentiles. Whiskers depict the range of all data points. Horizontal lines within boxes represent mean values. n indicates the number of biologically independent samples.
c, Kaplan-Meier plots of GBM patients grouped by lysine catabolism signature score.
d-f, Cell proliferation of GSCs (d), DGCs (e) and NSCs (f) cultured in media with indicated concentrations of L-lysine. Lysine-deprived DMEM supplemented with 10% dialyzed FBS and indicated concentrations of L-lysine was used to culture DGCs.
g, IB analysis of GSC23 cultured in media with indicated concentrations of L-lysine for 5 days. 1 μM Puromycin was added 30 min before harvest.
h, i, SLC7A1 (h) and SLC7A2 (i) expression levels in GSCs, DGCs, and NSCs. Boxes represent data within the 25-to-75 percentiles. Whiskers depict the range of all data points. Horizontal lines within boxes represent mean values. Three GSCs (MGG4, MGG6 and MGG8, each cell contains 3 replicates) and matched DGCs were queried in GSE54791. n = 8 biologically independent cells in NSCs and GSCs from GSE119834.
j, H3K27ac ChIP-seq tracks at SLC7A1 and SLC7A2 gene loci.
k, IF staining of SLC7A2 in GSCs, DGCs and NSCs. Scale bar, 20 μm.
l, IB analysis of GSCs with or without SLC7A2 KD.
m, Volcano plot showing altered amino acids upon SLC7A2 KD in two GSCs. Fold changes in amino acid levels relative to the average of control group are displayed.
n, Relative arginine levels (n = 4 biologically independent samples) in two GSCs with or without SLC7A2 KD by MS.
Data are presented from three independent experiments in d-f. Representative of two independent experiments in g, k and l. Data are presented as mean ± SEM in d-f and n. One-way ANOVA followed by multiple comparisons with adjusted p values for b and n, log-rank test for c, two-way ANOVA followed by multiple comparisons with adjusted p values for d-f, two-tailed unpaired t test for h, i and m. ns, not significant.
