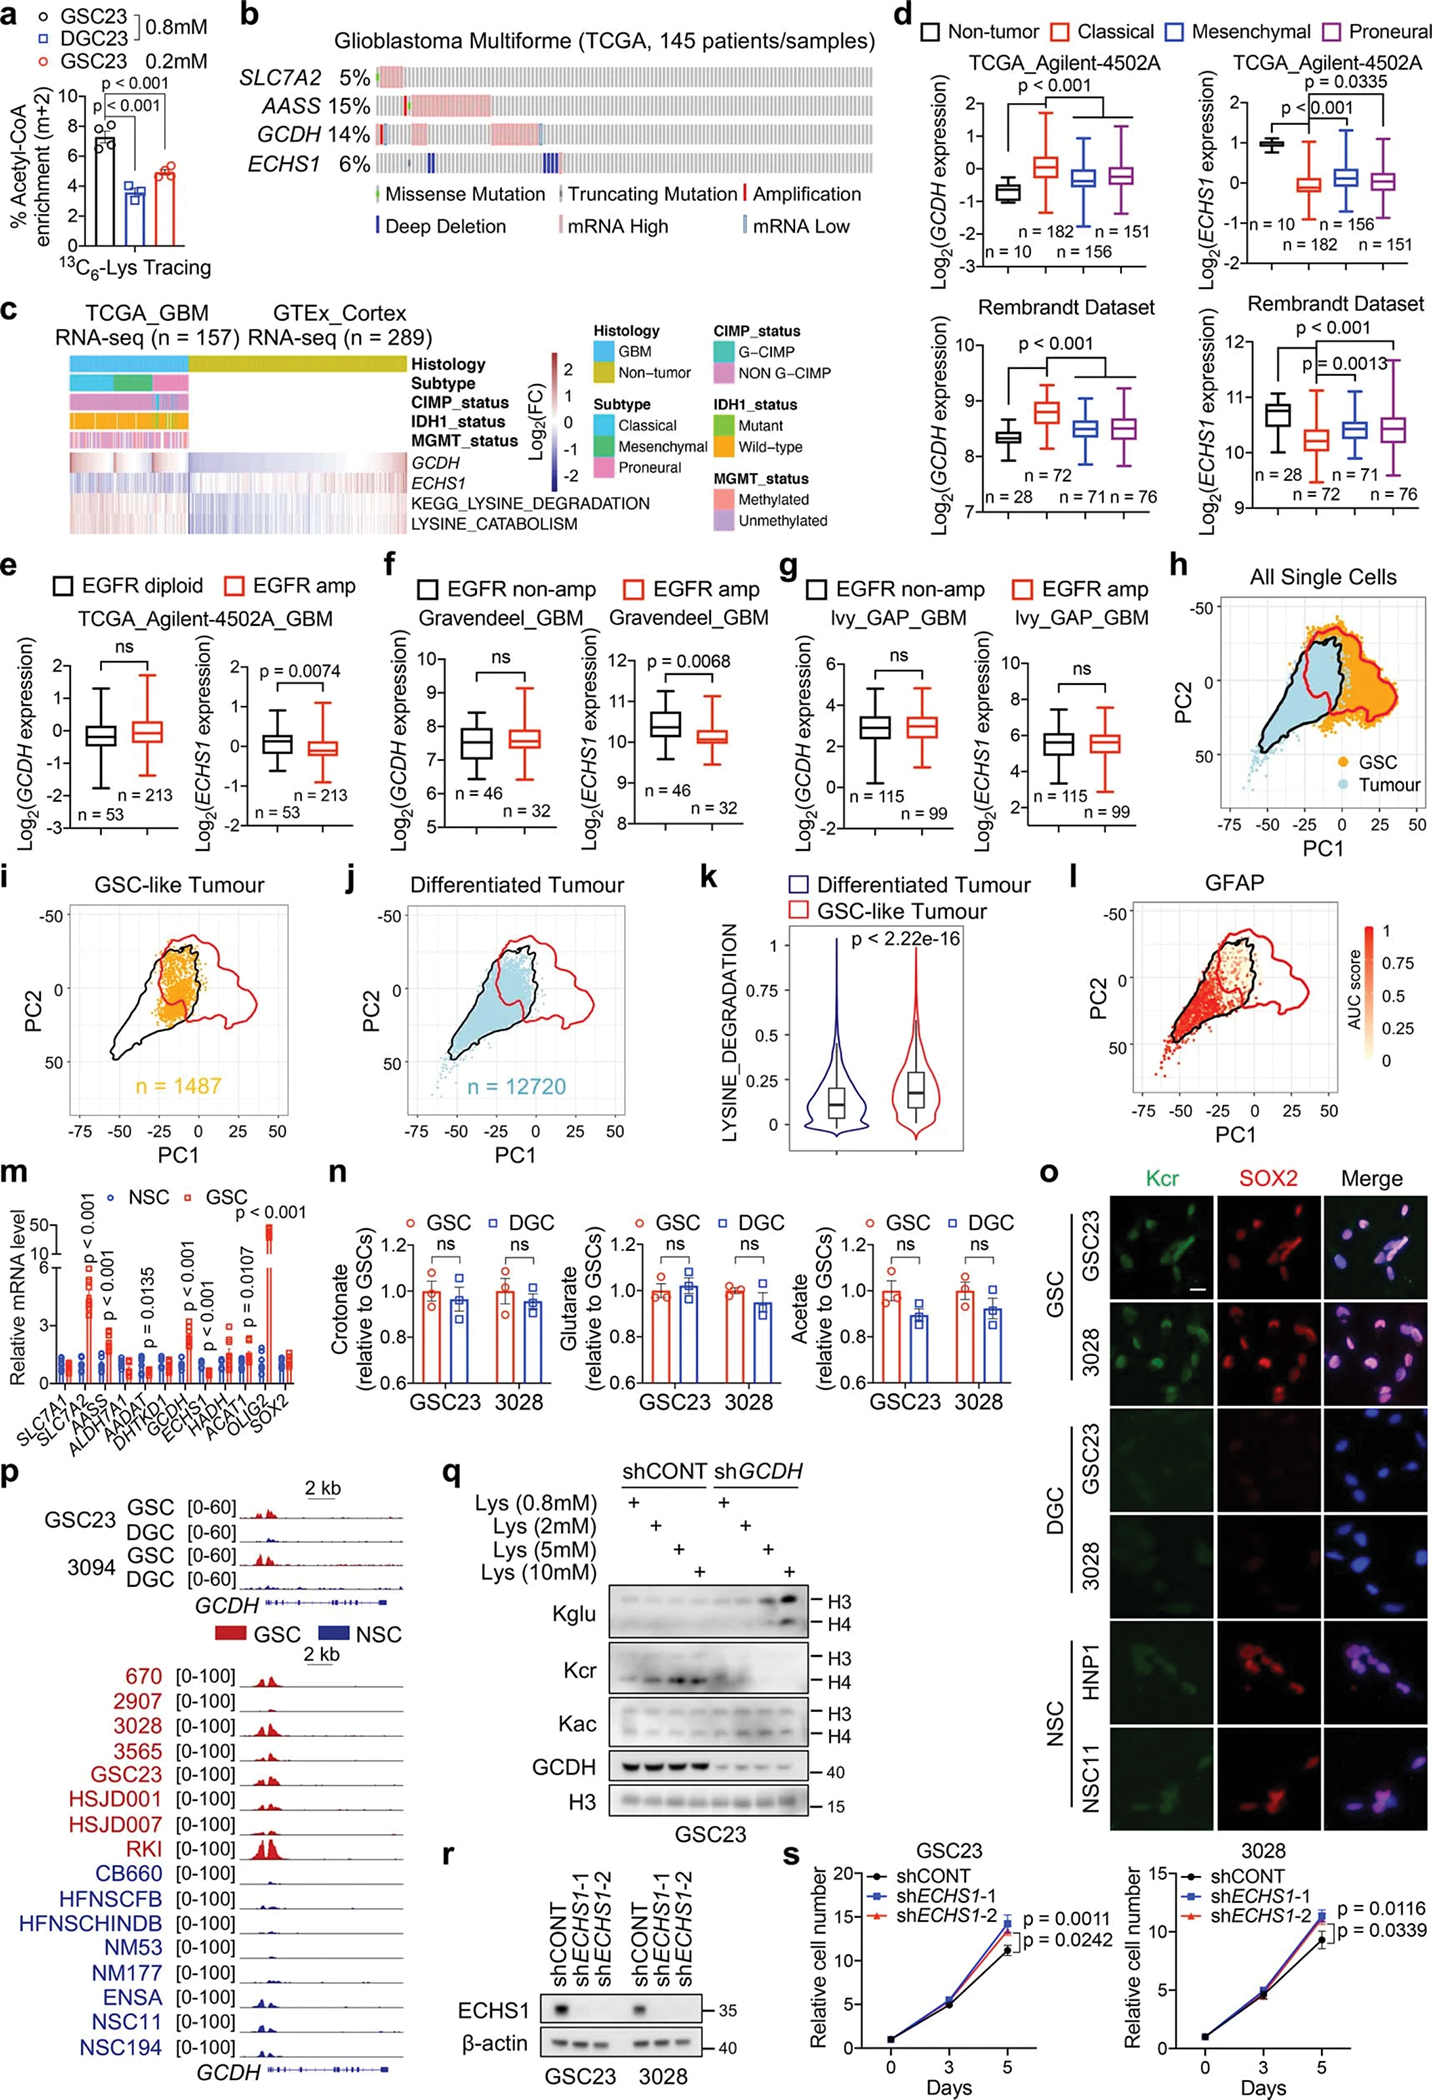
Extended Data Fig. 2. Reprogrammed lysine catabolism affects GSC growth via GCDH.

a, 13C6-lysine tracing assays in GSCs (n = 4 biologically independent samples) and DGCs (n = 3 biologically independent samples). Cells were given 13C6-lysine for 12 h.
b, Genomic alterations of SLC7A2, AASS, GCDH, and ECHS1 in TCGA GBM dataset from cBioPortal.
c, Heatmap displaying clinical information, GCDH, ECHS1 mRNA levels and lysine catabolism signature scores.
d-g, GCDH and ECHS1 expression in non-tumour brain tissue and three subtypes of GBM (d), and GBM samples with or without EGFR amplification (e-g) across datasets from GlioVis. Boxes represent data within the 25-to-75 percentiles. Whiskers depict the range of all data points. Horizontal lines within boxes represent mean values. n indicates the number of biologically independent samples.
h, PCA highlights overlap between GSCs (n = 65,655 cells from 28 GSC cultures) and malignant GBM tumour cells (n = 14,207 cells from 7 GBM tumours). Red and black lines represent contour encompassing 99% of GSCs and tumour cells, respectively.
i, j, GBM tumour cells classified as GSC-like tumour cells (i) or differentiated tumour cells (j).
k, Scoring of lysine degradation gene signature (12,720 differentiated tumour cells and 1,487 GSC-like tumour cells). Violin plots represent the overall distribution of data points. Boxes show median, upper and lower quartiles. Whiskers depict 1.5 times the interquartile range. l, Visualization of GFAP expression within GBM tumour cells.
m, RT-qPCR analysis of indicated genes in three GSCs (GSC23, 3028, and 3565) and NSCs (HNP1, NSC11, and ENSA).
n, Relative intracellular SCFAs (n = 3 biologically independent samples) in GSCs and DGCs.
o, IF staining of Kcr in GSCs, DGCs and NSCs. Scale bar, 20 μm.
p, H3K27ac ChIP-seq tracks at GCDH gene locus.
q, IB analysis of GSC23 cultured in media with indicated concentrations of L-lysine for 5 days.
r, s, IB (r) and cell proliferation (s) of two GSCs with or without ECHS1 KD.
Data are presented from three independent experiments in m and s. Representative of two independent experiments in o, q and r. Data are presented as mean ± SEM in a, m, n and s. One-way ANOVA followed by multiple comparisons with adjusted p values for a and d, two-tailed unpaired t test for e-g, k, m and n, two-way ANOVA followed by multiple comparisons with adjusted p values for s. ns, not significant.
