
Extended Data Fig. 4. Lysine catabolism modulates IFN signalling and cell growth in vitro.
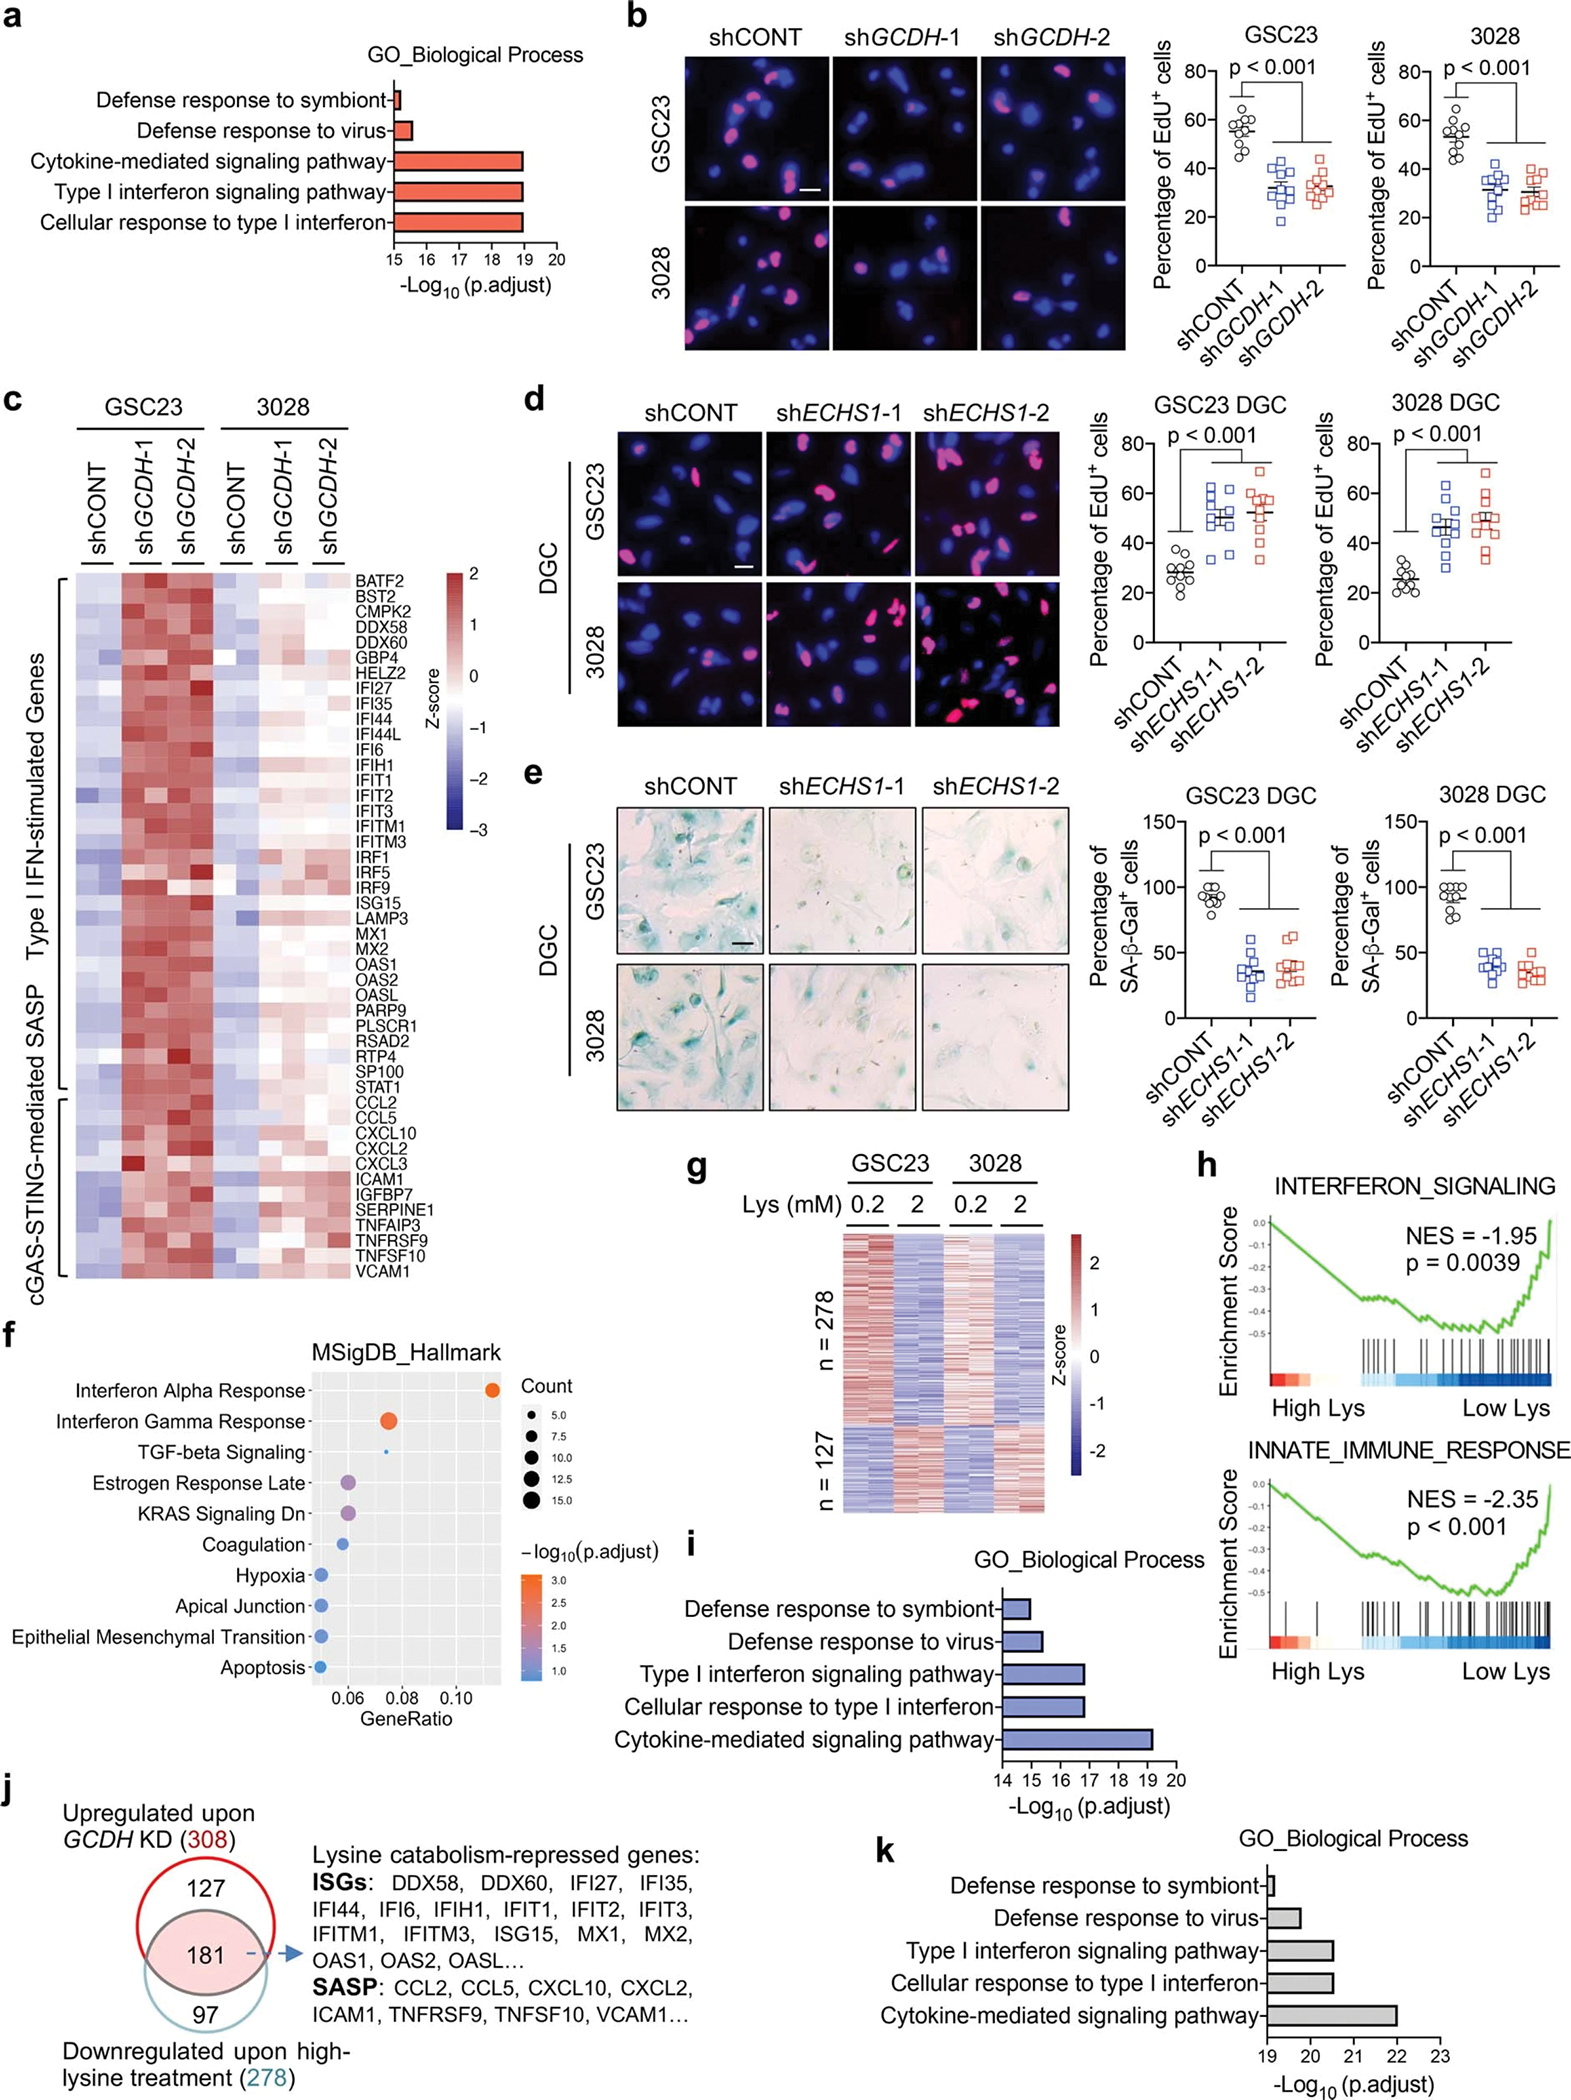
a, GO enrichment analysis of 308 upregulated genes upon GCDH KD, ranked by adjusted p values.
b, Representative images and quantification of EdU+ proportion of GSCs with or without GCDH KD. GSCs were exposed to 10 μM EdU for 2 h. Scale bar, 20 μm.
c, Heatmap showing the upregulated ISGs and SASP factors from RNA-seq upon GCDH loss in GSCs.
d, e, Proportion of EdU+ (d) and SA-β-Gal+ (e) DGCs with or without ECHS1 KD after 21 days in culture. DGCs were exposed to 10 μM EdU for 12 h. Scale bar, 20 μm.
f, Dot plot summarizing top 10 signalling pathways enriched in the 468 downregulated genes upon ECHS1 KD in two DGCs, ranked by adjusted p values.
g, Heatmap summarizing the DEGs of two GSCs cultured in media with indicated concentrations of L-lysine.
h, GSEA of two top pathways among DEGs from two GSCs cultured in media with high or low L-lysine. Normalized enrichment score (NES) and adjusted p values are shown.
i, Enrichment analysis of the 278 downregulated genes upon high L-lysine treatment in GSCs, ranked by adjusted p values.
j, Venn diagram showing the overlapping genes with increased expression upon GCDH depletion and decreased expression by high-lysine treatment in two GSCs.
k, Enrichment analysis of the 181 overlapping genes, ranked by adjusted p values. Representative of two independent experiments in b, d and e, and data are presented as mean ± SEM. One-way ANOVA followed by multiple comparisons with adjusted p values for b, d and e.