
Figure 3.
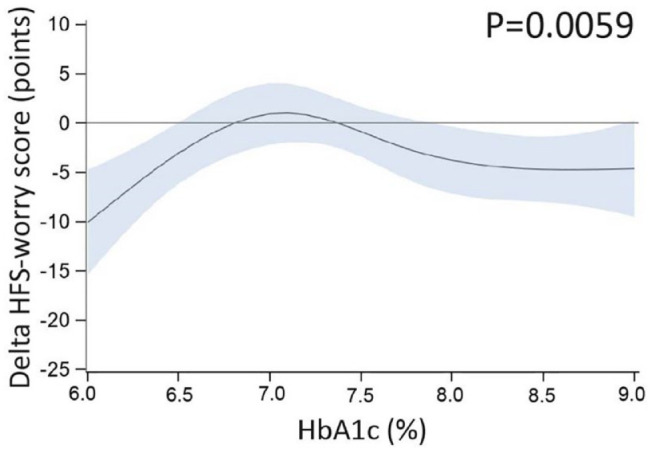
Univariable moderator analysis—HFS-worry score and baseline HbA1c. Result from a univariable moderator analysis, evaluating whether the difference in means of rtCGM versus isCGM at six months (delta) for HFS-worry score (plotted on the y-axis), depends on the level of baseline HbA1c (plotted on the x-axis). Dark blue lines represent the predicted mean delta, blue shaded areas represent the 95% confidence interval. A flatter line indicates less interaction, while a more curved line indicates more interaction. The P value for interaction is reported in the graph. Results show that there was dependency of delta HFS-worry score on HbA1c, indicating less worries with the use of rtCGM compared with isCGM in people with low (<6.5% [48 mmol/mol]) or high (≥8% [64 mmol/mol]) baseline HbA1c. To convert HbA1c from % to mmol/mol: (10.93 × [HbA1c %]) − 23.5 mmol/mol. Abbreviations: HFS-worry, Hypoglycemia Fear Survey version II worry subscale; rtCGM, real-time continuous glucose monitoring; isCGM, intermittently scanned continuous glucose monitoring; HbA1c, glycated hemoglobin.