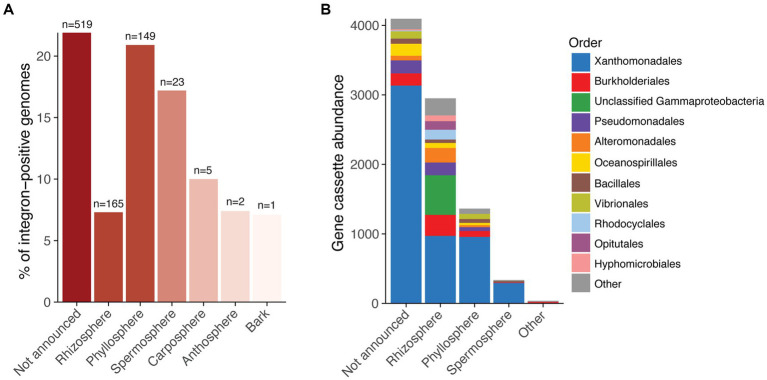
Figure 1.
Frequency of integrons in plant-associated bacterial genomes. (A) Percentage of bacterial genomes that carry integrons categorised by plant isolation site. The red colour scale indicates the number of genomes with integrons for each plant site, ranging from one genome (light red) to more than 500 genomes (dark red). The total number of genomes containing integrons is displayed above each bar. (B) Stacked bar chart showing gene cassette abundance for each plant site. Colours indicate the order-level taxonomy of the bacterial genomes in which the gene cassettes reside.

