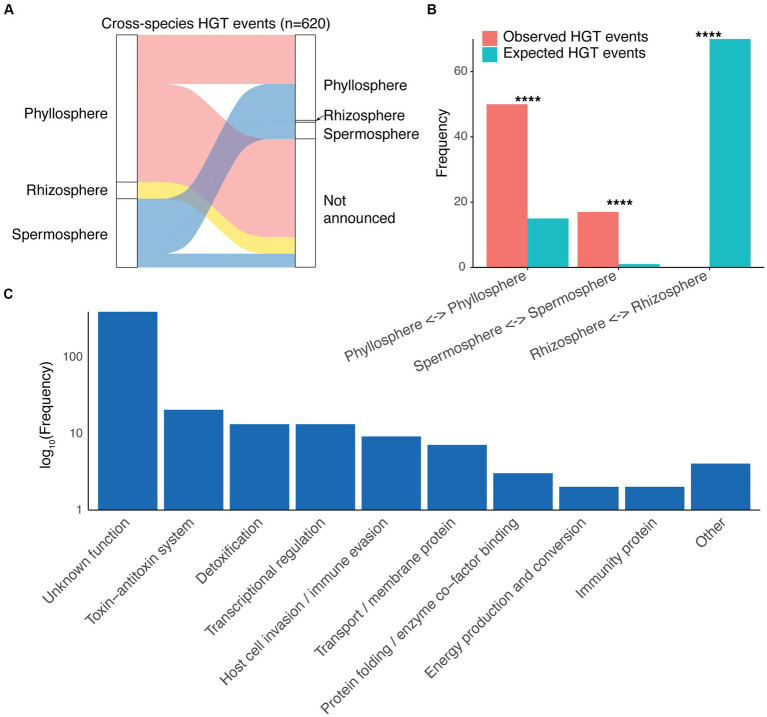
Figure 4.
Cross-species horizontal gene cassette transfer. (A) A Sankey diagram showing cross-species horizontal gene transfer (HGT) among bacteria isolated from different plant sites. For clarity, cases of HGT in which both species had plant isolation sites as “Not announced” are omitted. (B) Observed abundance of cross-species HGT events within each plant site compared to HGT counts that would be expected probabilistically based on cassette abundances for each plant site. All comparisons were statistically significant (p < 0.001), as determined by Fisher’s exact tests. (C) Abundances (log10 scale) of different functions assigned to horizontally transferred gene cassette proteins.

