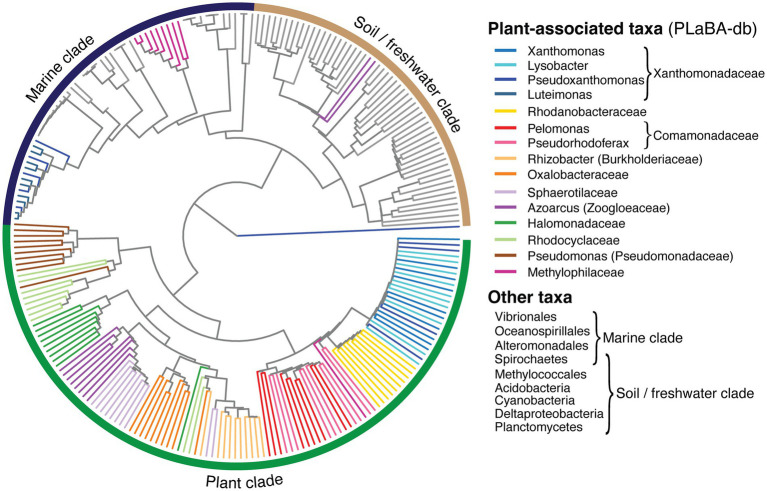
Figure 5.
attC structural homology tree. Inferred relationships between representative attC sites obtained from plant-associated taxa (coloured branches) within PLaBA-db (Patz et al., 2021), and diverse integron-carrying bacteria (grey branches) identified in Ghaly et al. (2021b).

