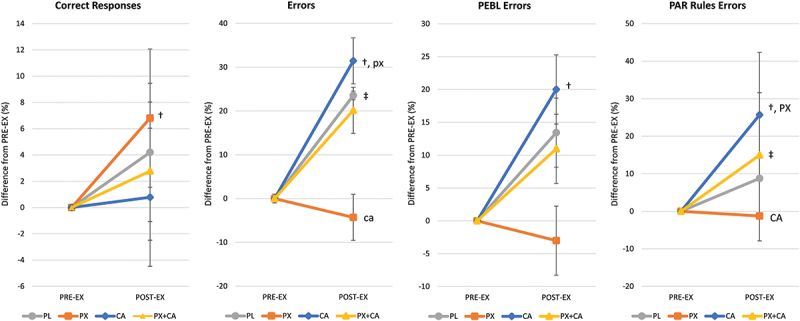
Figure 3.

Berg-Wisconsin Card Sorting test mean percent changes from pre-exercise (PRE-EX) values with 95% confidence intervals. † represents p < 0.05 from PRE-EX values while ‡ represents p > 0.05 to p < 0.10 effect. Treatment differences (p < 0.05) are shown as differences from placebo (PL), paraxanthine (PX), caffeine (CA) and PX + CA. Statistical trends (p > 0.05 to p < 0.10) are shown as small case (pl, px, ca, px+ca).
