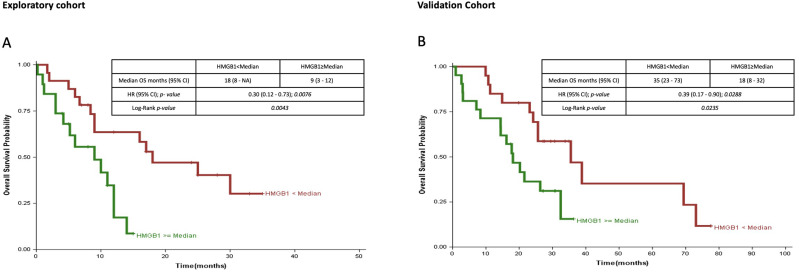
Figure 2.
Overall survival (OS) analysis according to HMGB1 mRNA expression levels (lower versus higher that the median value). (A) In the exploratory cohort (n=42), there was a significant difference in overall survival for patients with low HMGB1 versus high HMGB1 mRNA expression level (hazard ratio [HR], 0.30; 95% CI, 0.12–0.73; P=0.0076) (B) In the validation cohort (n=41), a significant difference in overall survival was confirmed for patients with low versus high HMGB1 mRNA expression level (HR, 0.39; 95% CI, 0.17–0.90; P=0.0288).

