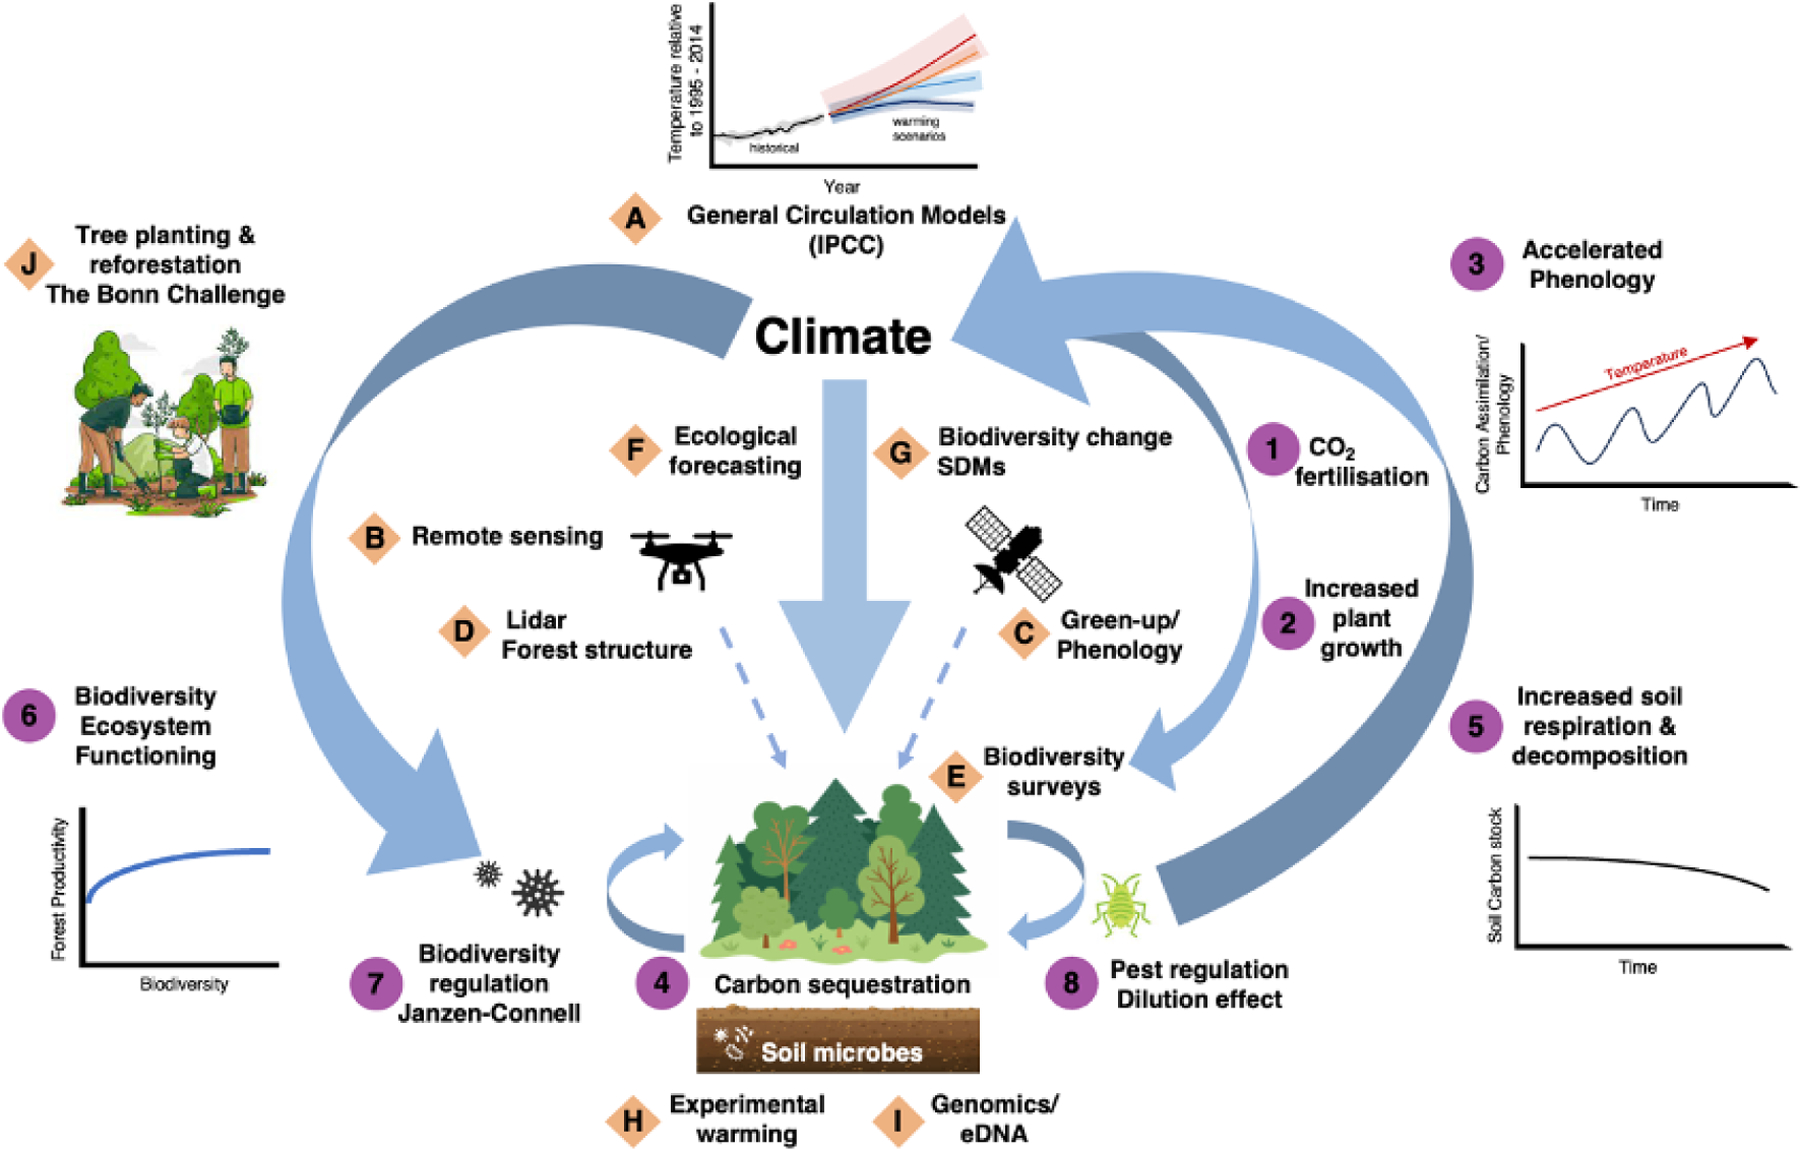
Fig. 3: Schematic illustrating mechanisms underlying key pathways and feedbacks linking between biodiversity, disease dynamics and the climate system (numbers), and the research tools and data types that allow us to quantify them (letters).

Climate determines rates of primary productivity (central arrow). Warming temperatures and CO2 fertilisation (1) accelerate plant growth (2) and the timing of annual life cycle events (3). Increased plant growth sequesters atmospheric CO2 (4), but warming soils elevate respiration and decomposition rates of soil microbes (5) which releases CO2 back into the atmosphere. Increased biodiversity enhances ecosystem productivity (6), and thus rates of CO2 fixation. Pests and disease can regulate and maintain biodiversity through Janzen-Connell effects (7) while biodiversity can modify disease outbreaks through the dilution effect (8). General climate circulation models (A) and synthesis reports from the Intergovernmental Panel on Climate Change (IPCC) provide projections of likely climate responses to variation in atmospheric CO2 concentration. Remote sensing using satellites and drones (B) allows for real-time monitoring of plant phenological responses (C) to changes in climate and associated changes in vegetation structure (D). Remote sensed data and ‘on the ground’ biodiversity surveys (E) inform ecological forecasts (F) in combination with species distribution modelling (G). Experimental manipulations, such as experimental warming (H), and new genomic tools (I) that can detect evidence of selection provide quantitative measures of species’ adaptive and plastic potential to environmental changes. Nature-based solutions (J), including tree planting (see The Bonn Challenge: https://www.bonnchallenge.org/), provide potential for win-win-win scenarios, but only if enacted thoughtfully. See Table 1 for citations. We use a terrestrial forest ecosystem as example to illustrate system complexity; equivalent schematics could be generated for marine and freshwater ecosystems. We do not show interactions with the socio-economic system, including feedbacks with public health policy, disease surveillance, clean energy pathways etc. which would add further complexity.
