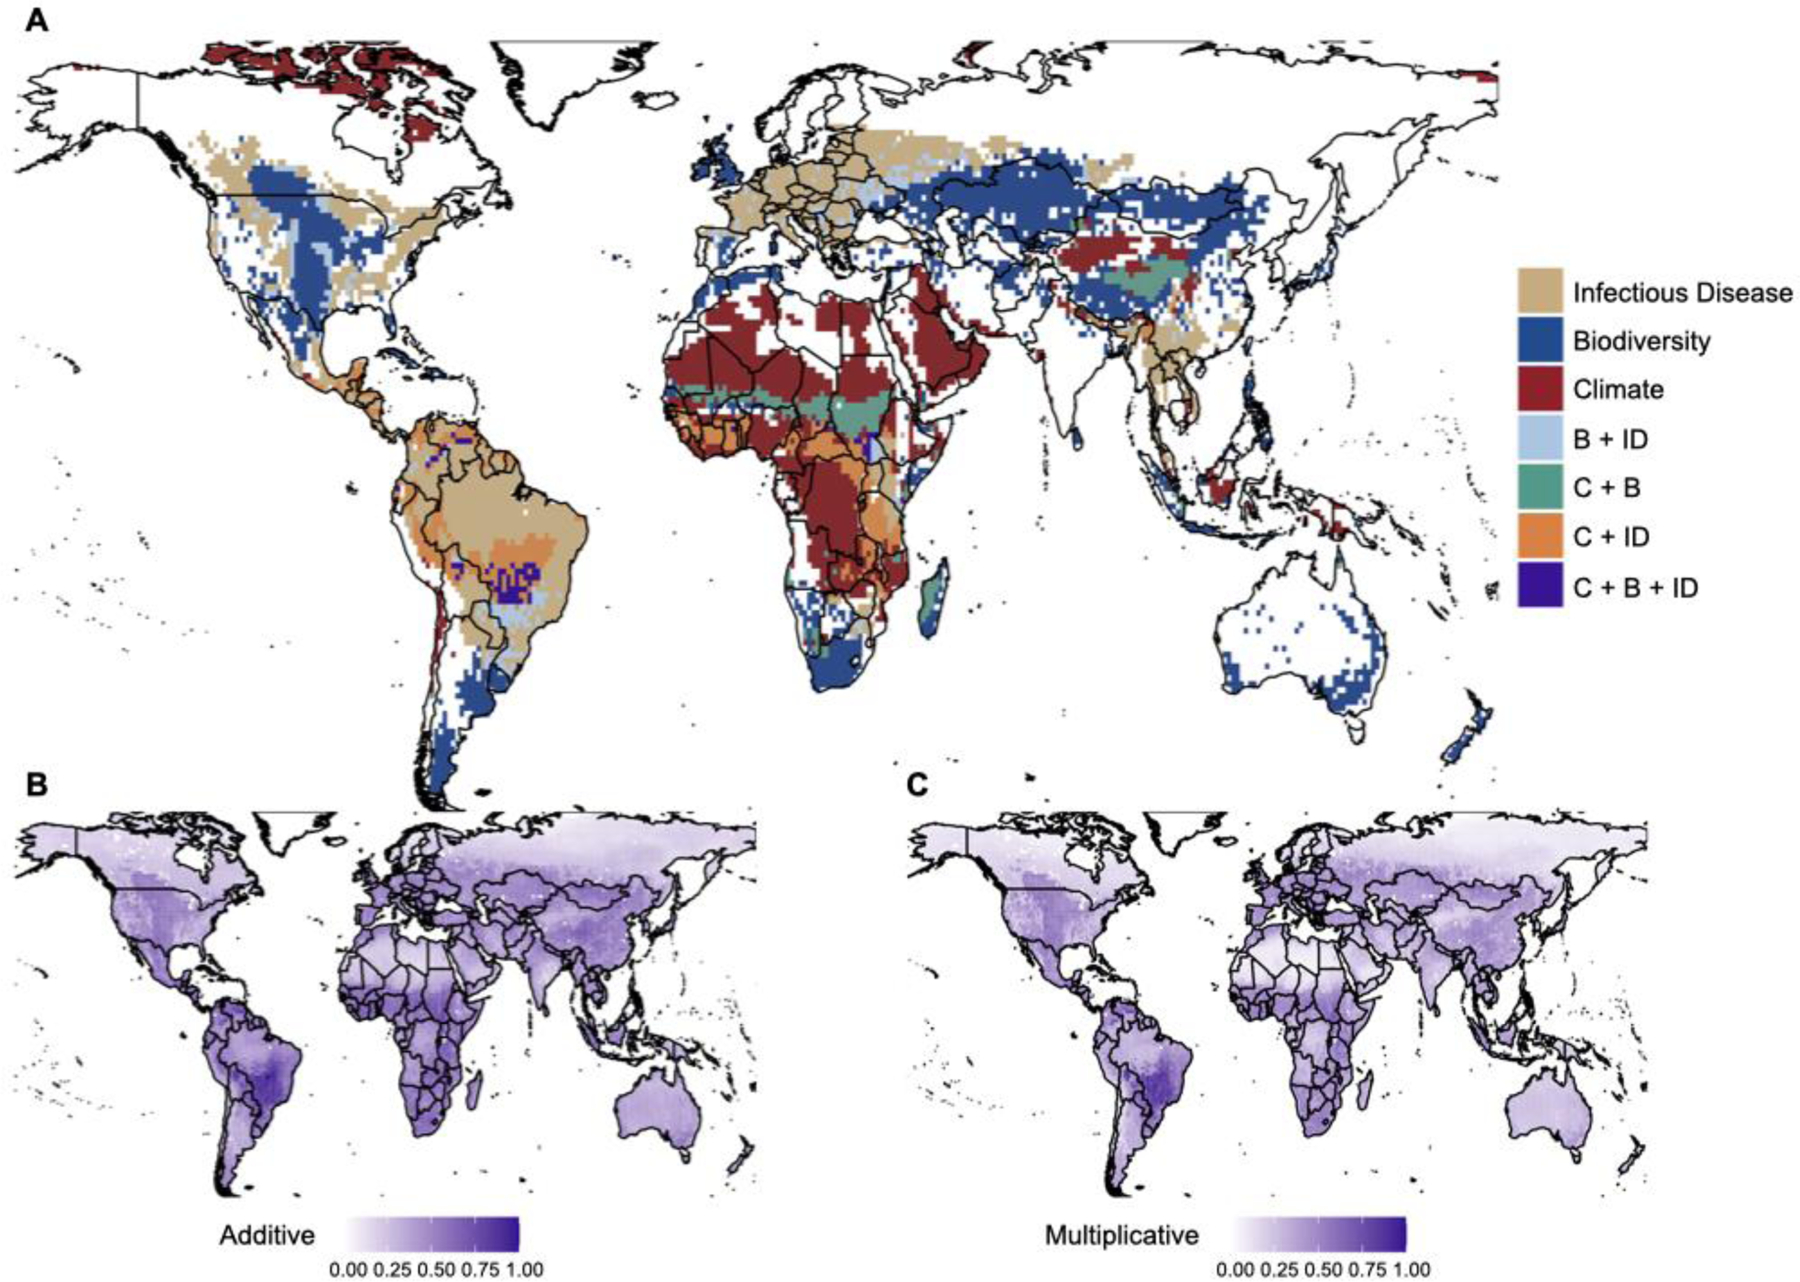
Fig. 4: Visualizing how pressures overlap in space could reveal the potential for interactions between them.

Maps depicting geographical overlap of global pressures: climate risk (C), biodiversity risk (B), and infectious disease risk (ID). A) Pressure hotspots, defined as cells falling within the upper 20% quantile of each pressure; B) Global pressures combined additively (datasets rescaled to between 0 and 1); and C) Global pressures combined multiplicatively (datasets rescaled to between 1 and 2). Climate change risk is measured as the standard Euclidean distance across multiple climate metrics between a baseline (1995–2014) and future (2080–2099) period under the Shared Socioeconomic Pathway (SSP) 2–4.5 scenario;198 Biodiversity is represented as the inverse of the Biodiversity Intactness Index (1-BII), which reflects the proportional loss of species richness in a given area relative to minimally-impacted baseline sites in 2005;199 Disease risk is represented by mammal zoonotic host richness,200 a measure of both biodiversity and zoonotic infectious disease burden. Further details are provided in the Supplementary Methods.
