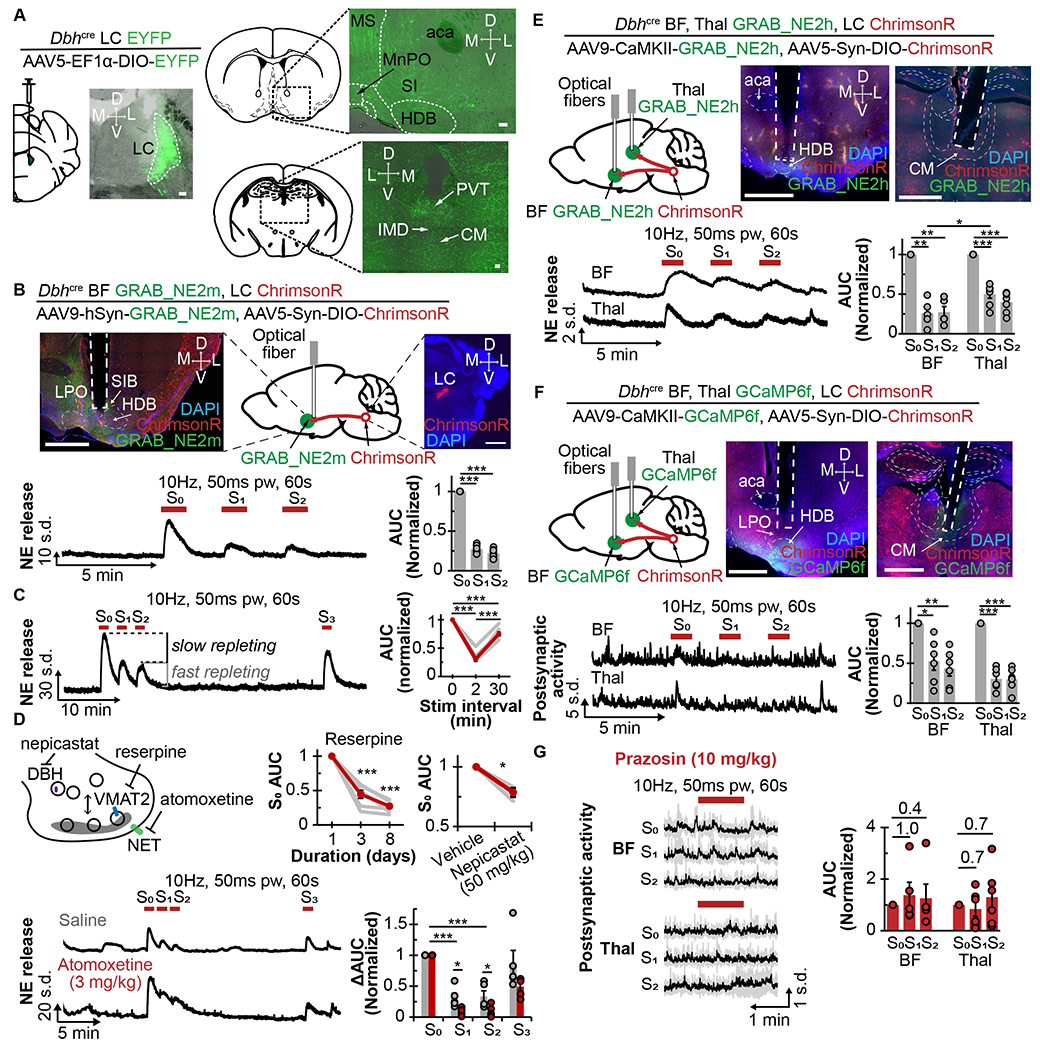
Figure 1. in vivo constraints on norepinephrine signaling.

A. Left, schematic shows cre-inducible EYFP virus injected into the LCNE of Dbh-cre mice, accompanied by coronal sections showing EYFP expression in the LC. Right, schematic and coronal sections show the basal forebrain (top) and medial thalamus (bottom). Scale bars are 100μm. aca, anterior. CM, centromedian. HDB, horizontal limb of the diagonal band of Broca. IMD, intermediodorsal nucleus. MS, medial septum. MnPO, median preoptic nucleus. PVT, paraventricular thalamus. SI, substantia innominata.
B. Top, schematic and coronal sections show expression of ChrimsonR in LCNE; and GRAB_NE2m and optical fiber in the basal forebrain (BF). Scale bars are 1mm. HDB, horizontal limb of the diagonal band. LPO, lateral preoptic area. SIB basal portion of substantia innominata. Bottom left, trace shows NE release in response to repeated axonal photostimulation at 10Hz, 50ms pw for 60s at 2min intervals. Bottom right, quantification of AUC normalized to S0 response (N=8).
C. Left, trace shows NE release with repeated photostimulations at 10Hz, 50ms pw for 60s at 2min and 30min intervals. Right, graph shows corresponding AUC normalized to So response (N=8).
D. Top left, diagram shows the drugs used to alter presynaptic NE metabolism. Top right, graphs show normalized AUC S0 after multiple days of reserpine treatment (SFig 1C , N=7) and 2h after intraperitoneal (i.p.) administration of 50mg/kg nepicastat (N=3). Bottom left, traces of NE release 20min after i.p. saline (gray) or atomoxetine (red) with repeated 10Hz photostimulations. Bottom right, graph shows changes to AUC normalized to S0 response (N=3).
E. Top left, schematic shows expression of ChrimsonR in LCNE, and GRAB_NE2h and optical fibers in BF and Thal. Top right, histological coronal brain slices show viral expressions and optical fiber placements in Thal and BF. Scale bars are 1mm. CM, centromedian nucleus. aca, anterior commissure. HDB, horizontal limb of diagonal band. Bottom left, traces show NE release in response to 10Hz photostimulation in the BF and Thal. Bottom right, plot shows corresponding AUC normalized to S0 response in BF (N=5) and Thal (N=7), respectively.
F. Top left, schematic shows expression of ChrimsonR in LCNE, and GCaMP6f and optical fibers in BF and Thal. Top middle and right, histological coronal brain slices show viral expressions and optical fiber placement in Thal and BF. Scale bars are 1mm. CM, centromedian nucleus. aca, anterior commissure. HDB, horizontal limb of diagonal band. Bottom left, traces show postsynaptic activity in response to 10Hz photostimulation in BF and Thal. Bottom right, plot shows AUC normalized to So response in BF (N=6) and Thal (N=6), respectively.
G. Left, average traces show the postsynaptic activity in BF and Thal in response to repeated 10Hz photostimulations 20min after i.p. 10mg/kg prazosin injection. Right, plot shows AUC normalized to S0 response in BF (N=6) and Thal (N=6), respectively.
*p<0.05, **p<0.01, ***p<0.001. Graphs: mean±SEM; photometry traces: mean±std.
