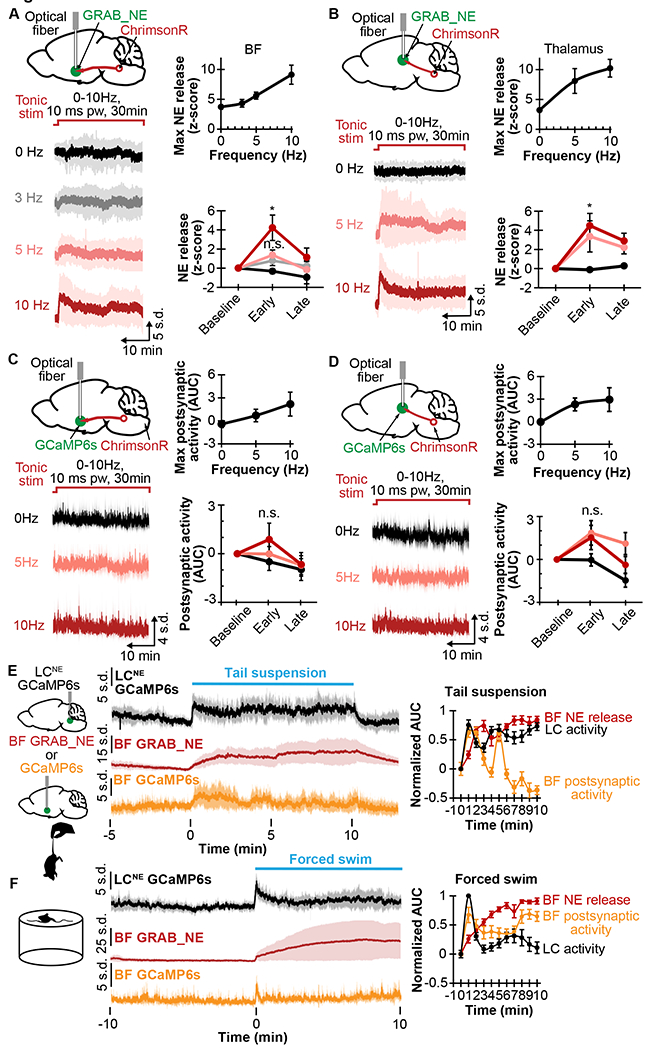
Figure 2. Norepinephrine depletion and postsynaptic response to varying stimulation frequency and stress.

A. Left top, schematic shows ChrimsonR in LCNE, and GRAB_NE and optical fiber in BF. Left bottom, average traces show NE release with 30min photostimulation at 0, 3, 5, and 10Hz 10ms pw. Right top, plot shows maximum NE release in relation to stimulation frequency (N=8). Right bottom, plot shows NE release at baseline (1min before stimulation), early stimulation (1-5min), and late stimulation (25-30min) at different stimulation frequencies (N=8).
B. Left top, schematic shows ChrimsonR in LCNE, and GRAB_NE and optical fibers in Thal. Left bottom, average traces show NE release with 30min photostimulation at 0, 5, and 10Hz 10ms pw. Right top, plot shows maximum NE release in relation to stimulation frequency (N=7). Right bottom, plot shows NE release at the baseline (1min before stimulation), early stimulation (1-5min), and late stimulation (25-30min) at different stimulation frequencies (N=7).
C. Left top, schematic shows ChrimsonR in LCNE, GCaMP6f in BF, and implanted optical fiber in BF. Left bottom, average traces show postsynaptic activity with 30min photostimulation at 0, 3, 5, and 10Hz 10ms pw. Right top, plot shows maximum postsynaptic activity in relation to stimulation frequency (N=6). Right bottom, plot shows postsynaptic activity at baseline (1min before stimulation), early stimulation (1-5min), and late stimulation (25-30min) at different frequencies (N=6).
D. Left top, schematic shows ChrimsonR in LCNE, GCaMP6f in Thal, and implanted optical fiber in Thal. Left bottom, average traces show postsynaptic activity with 30min photostimulation at 0, 5, and 10Hz 10ms pw. Right top, plot shows maximum postsynaptic activity in relation to stimulation frequency (N=6). Right bottom, plot shows postsynaptic activity at the baseline (1min before stimulation), early stimulation (15min), and late stimulation (25-30min) at different frequencies (N=6).
E. Left, schematic shows GCaMP6s in LCNE, GRAB_NE or GCaMP6f in BF, and tail suspension. Right, plots show corresponding traces of the LCNE activity (N=6), BF NE release (N=8), and BF postsynaptic activity (N=6), and corresponding AUC in 1-min binning normalized to 1min before 10min tail suspension.
F. Left, schematic shows forced swim. Right, plots show traces of LCNE activity (N=7), BF NE release (N=6), and BF postsynaptic activity (N=7); and corresponding AUC in 1min binning normalized to 1min before forced swim.
*p<0.05. n.s. not significant. Graphs: mean±SEM; photometry traces: mean±std.
