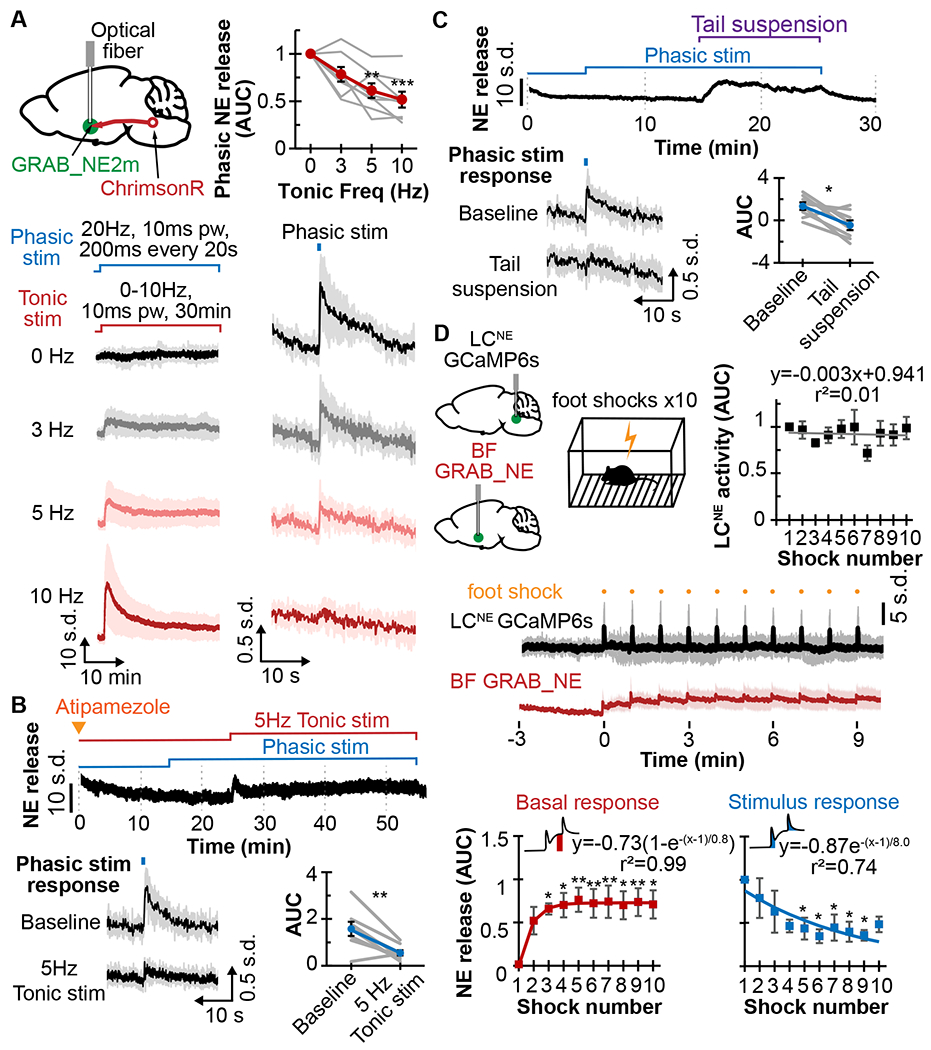
Figure 3. Phasic norepinephrine release constrained by tonic activity.

A. Top left, schematic shows ChrimsonR expressed in LCNE, GRAB_NE2m in BF, and an implanted optical fiber in BF. Bottom, traces of NE release for 30min of 0, 3, 5, and 10Hz tonic photostimulation (left) with 20Hz, 10ms pw, 200ms phasic stimulation every 20s (right). Top right, plot shows the relation between AUC of phasic NE release and tonic stimulation frequency (N=8).
B. Top, trace shows NE release in response to phasic photostimulations (20Hz, 10ms pw for 200ms every 20s) after 1mg/kg atipamezole treatment, with or without 5Hz tonic photostimulation. Bottom left, averaged traces are shown in response to phasic stimulation at baseline and during 5Hz tonic stimulation. Bottom right, corresponding AUC of phasic NE release is shown (N=8).
C. Top, trace shows NE release in response to 10min tail suspension with 20Hz, 10ms pw, 200ms phasic stimulation. Bottom left, averaged traces are shown in response to phasic stimulation at baseline and during tail suspension. Bottom right, corresponding AUC of phasic NE release is shown (N=8).
D. Top left, schematic shows GCaMP6s in LCNE, GRAB_NE in BF, and mouse experiencing 10 footshocks. Middle, average traces are shown of LCNE activity (black) and GRAB_NE in the BF (red) in response to footshocks. Top right, plot shows the AUC of LCNE activity in response to footshocks (N=7). Bottom, plots show the basal changes to NE release (left, red) and AUC of NE release (right, blue) in response to footshocks (N=8), along with exponential fitting curves and equations.
*p<0.05, **p<0.01, ***p<0.001. Graphs: mean±SEM; photometry traces: mean±std.
