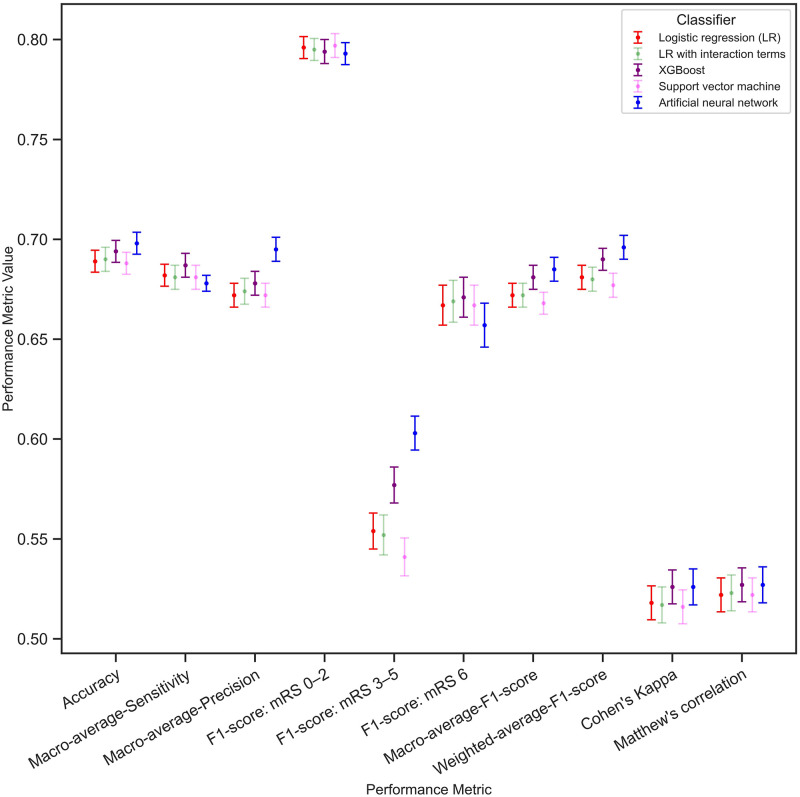
Fig 2. Performance metric values with their corresponding 95% confidence intervals for each classifier multinomial logistic regression (mLR), mLR with 2-way interaction terms, XGBoost, SVM, and ANN).
The x-axis shows different performance metrics with their corresponding values on the y-axis. Each dot is the estimated value of the metric while the lines denote the 95% confidence intervals within which the value lies.

