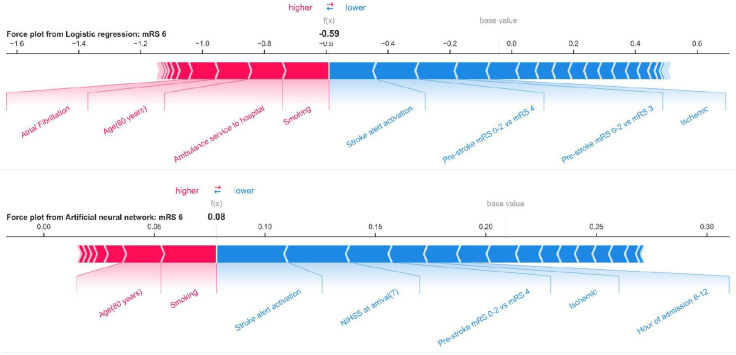
Fig 3. SHAP force plot of predictions from mLR and ANN classifiers for death at a patient level.
The colors show whether the feature increases (red) or decreases (blue) the probability of death for this patient. Bar size denotes the SHAP value. The longer the bar the greater the influence on prediction. The base value indicates the average prediction (with no feature in the model) of the model (log odds) based on the training data, while f(x) is the final predicted probability of the mentioned patient to belong to this outcome class (death).

