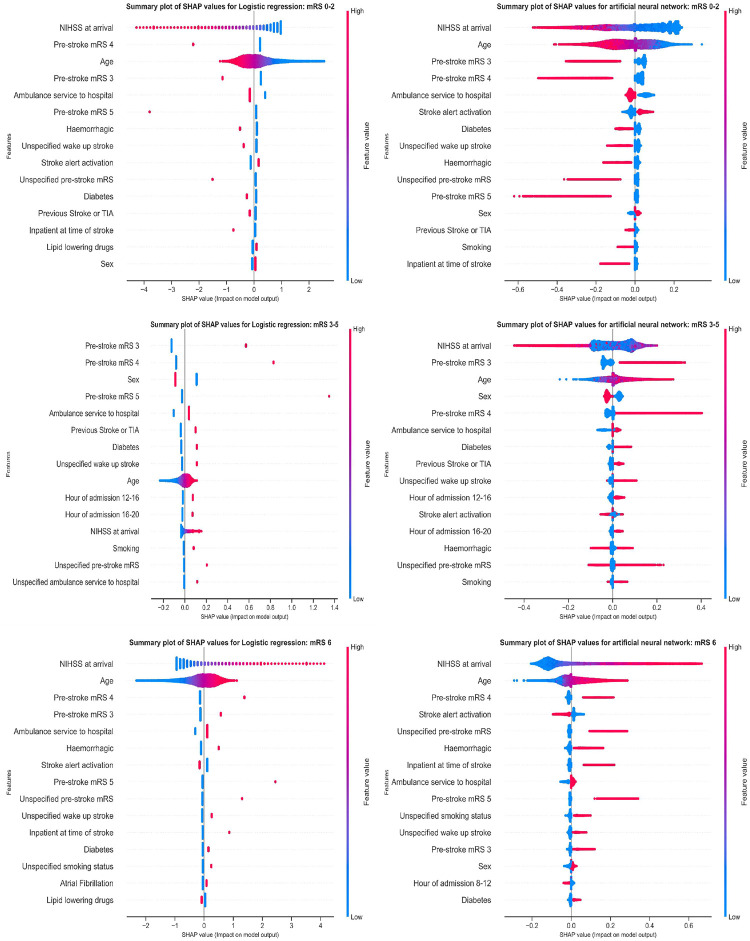
Fig 4. SHAP plots for mLR and ANN classification models for each mRS category.
The features are given in order of importance together with the corresponding mean absolute SHAP value. For each feature, a patient is represented by a point (dot) distributed horizontally along the x-axis based on the SHAP value. Red and blue points are the high (male sex or yes for other binary features) and low (female sex or no for other binary features) feature values, respectively. The horizontal axis indicates the feature effect on prediction (either increasing or decreasing the probability of belonging to that outcome class).

