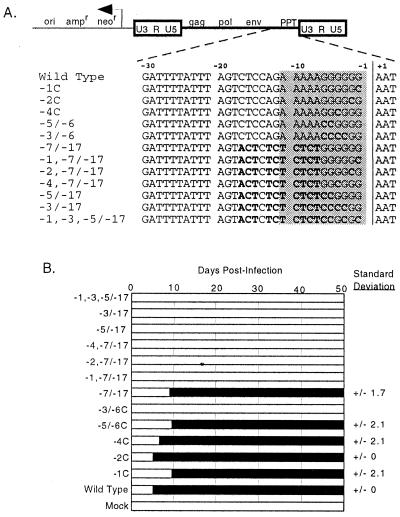
FIG. 1.
Targeted 3′ untranslated region mutations. (A) The mutations. Shown at the top is the structure of the pMLV-neo proviral plasmid. Dashed lines indicate the position of sequences shown below. For mutants, differences from wild type are boldfaced. The core PPT is shaded. The vertical line indicates the PPT/U3 boundary and the normal site of plus-strand primer cleavage. (B) Replication efficiency of mutants. The leftmost edge of the black bars indicates the time point at which virus spread was first detected. Standard deviations, in days, of time points when replication was detected are shown at the right for those mutants that replicated.

