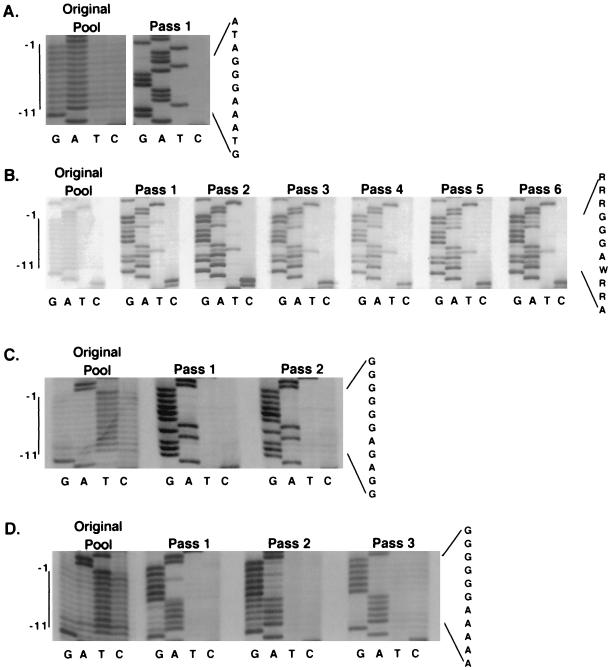
FIG. 5.
Evolution of the GATC PPT pools. Sequences of PCR-amplified PPT regions of unintegrated viral DNA harvested from Rat2 cells infected with GATC PPT pool virus and of PCR products of the original plasmid pools were determined. (A) Evolution of a subset of the 530-member GATC PPT pool. The original GATC PPT plasmid pool is shown on the left. Sequencing of the pool after a single passage is shown on the right. On the far right is the predominant sequence after passage. At the far left, the position of the core PPT is indicated. (B) Evolution of the complete 530-member GATC pool. On the left is this GATC PPT plasmid pool. Six passages of the pool are then shown. The predominant sequence postpassage is shown at the right. (C) Evolution of the 4,000-member GATC pool. On the left is this GATC PPT plasmid pool before transfection. Two passages of the pool are then shown. Shown on the right is the predominant sequence after passage. (D) Evolution of the 5,000-member GATC pool. On the left is this pool before transfection. Three passages of the pool are shown. Shown on the right is the predominant postpassage sequence.

