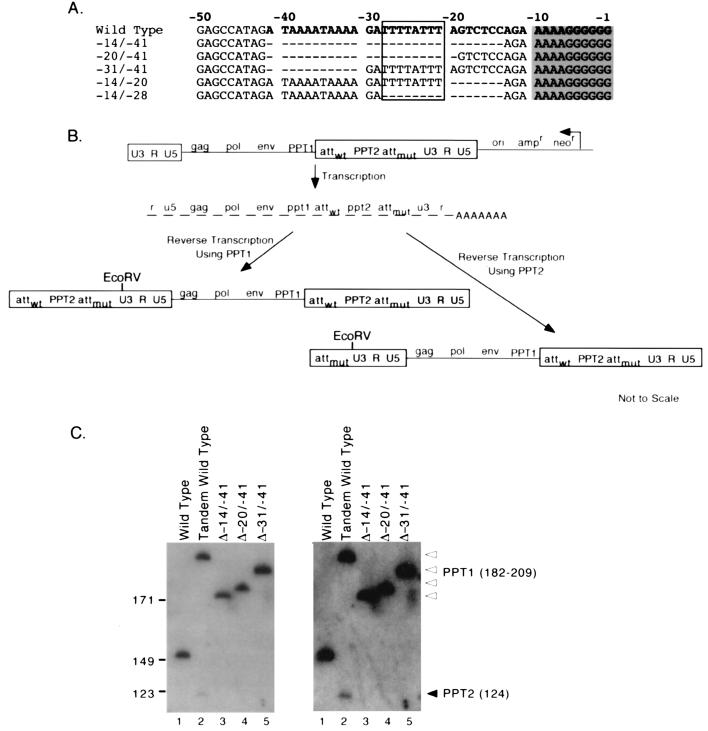
FIG. 8.
Effects of deletions upstream of the core PPT. (A) Deletions introduced upstream of the core PPT. Nucleotides shown in boldface are the same in both PPT1 and PPT2 of the wild-type tandem PPT construct. Dashes indicate position of deletions. When deletions were placed in tandem PPT constructs, they were introduced into PPT2. The core PPT is shaded, and the T stretch is boxed. (B) Schematic representation of the structure and predicted products of the tandem PPT construct. The second PPT inserted in U3 (PPT2) and mutated att (attmut) are shown. The first line indicates the structure of the transfected proviral construct. Boxed regions indicate LTRs. The structural organization of the encapsidated RNAs is indicated on the second line. The final two lines indicate the predicted structures of the reverse transcription products; the single RNA species on the second line generates two different DNA products that differ in their upstream LTRs. The EcoRV site used to generate end products for Southern blots is shown. Note that deletions introduced into PPT2 will alter the sizes of the reverse transcription product that result from PPT1 use but that products which result when PPT2 primes plus-strand synthesis will be the same size for all deletion mutants and for wild type. Drawings are not to scale. (C) Southern blot of EcoRV-digested nonintegrated viral DNA products. Marker (left) and product (right) lengths are indicated in base pairs. PPT1 bands are indicated with open arrowheads, and the PPT2 band is indicated with a filled arrowhead. PPT1 product sizes are as follows: 209 bp for wild-type tandem PPT1 products, 199 bp for Δ−31/−41, 188 bp for Δ−20/−41, and 182 bp for Δ−14/−41. PPT2 products are 124 bp for all constructs. The wild-type (single PPT) product is 144 bp. The panel on the right is a darker exposure of the one at the left.

