
Fig. 2 |. Genetic reduction of IS augments mitochondrial volume and function in dfmr1 mutant flies.
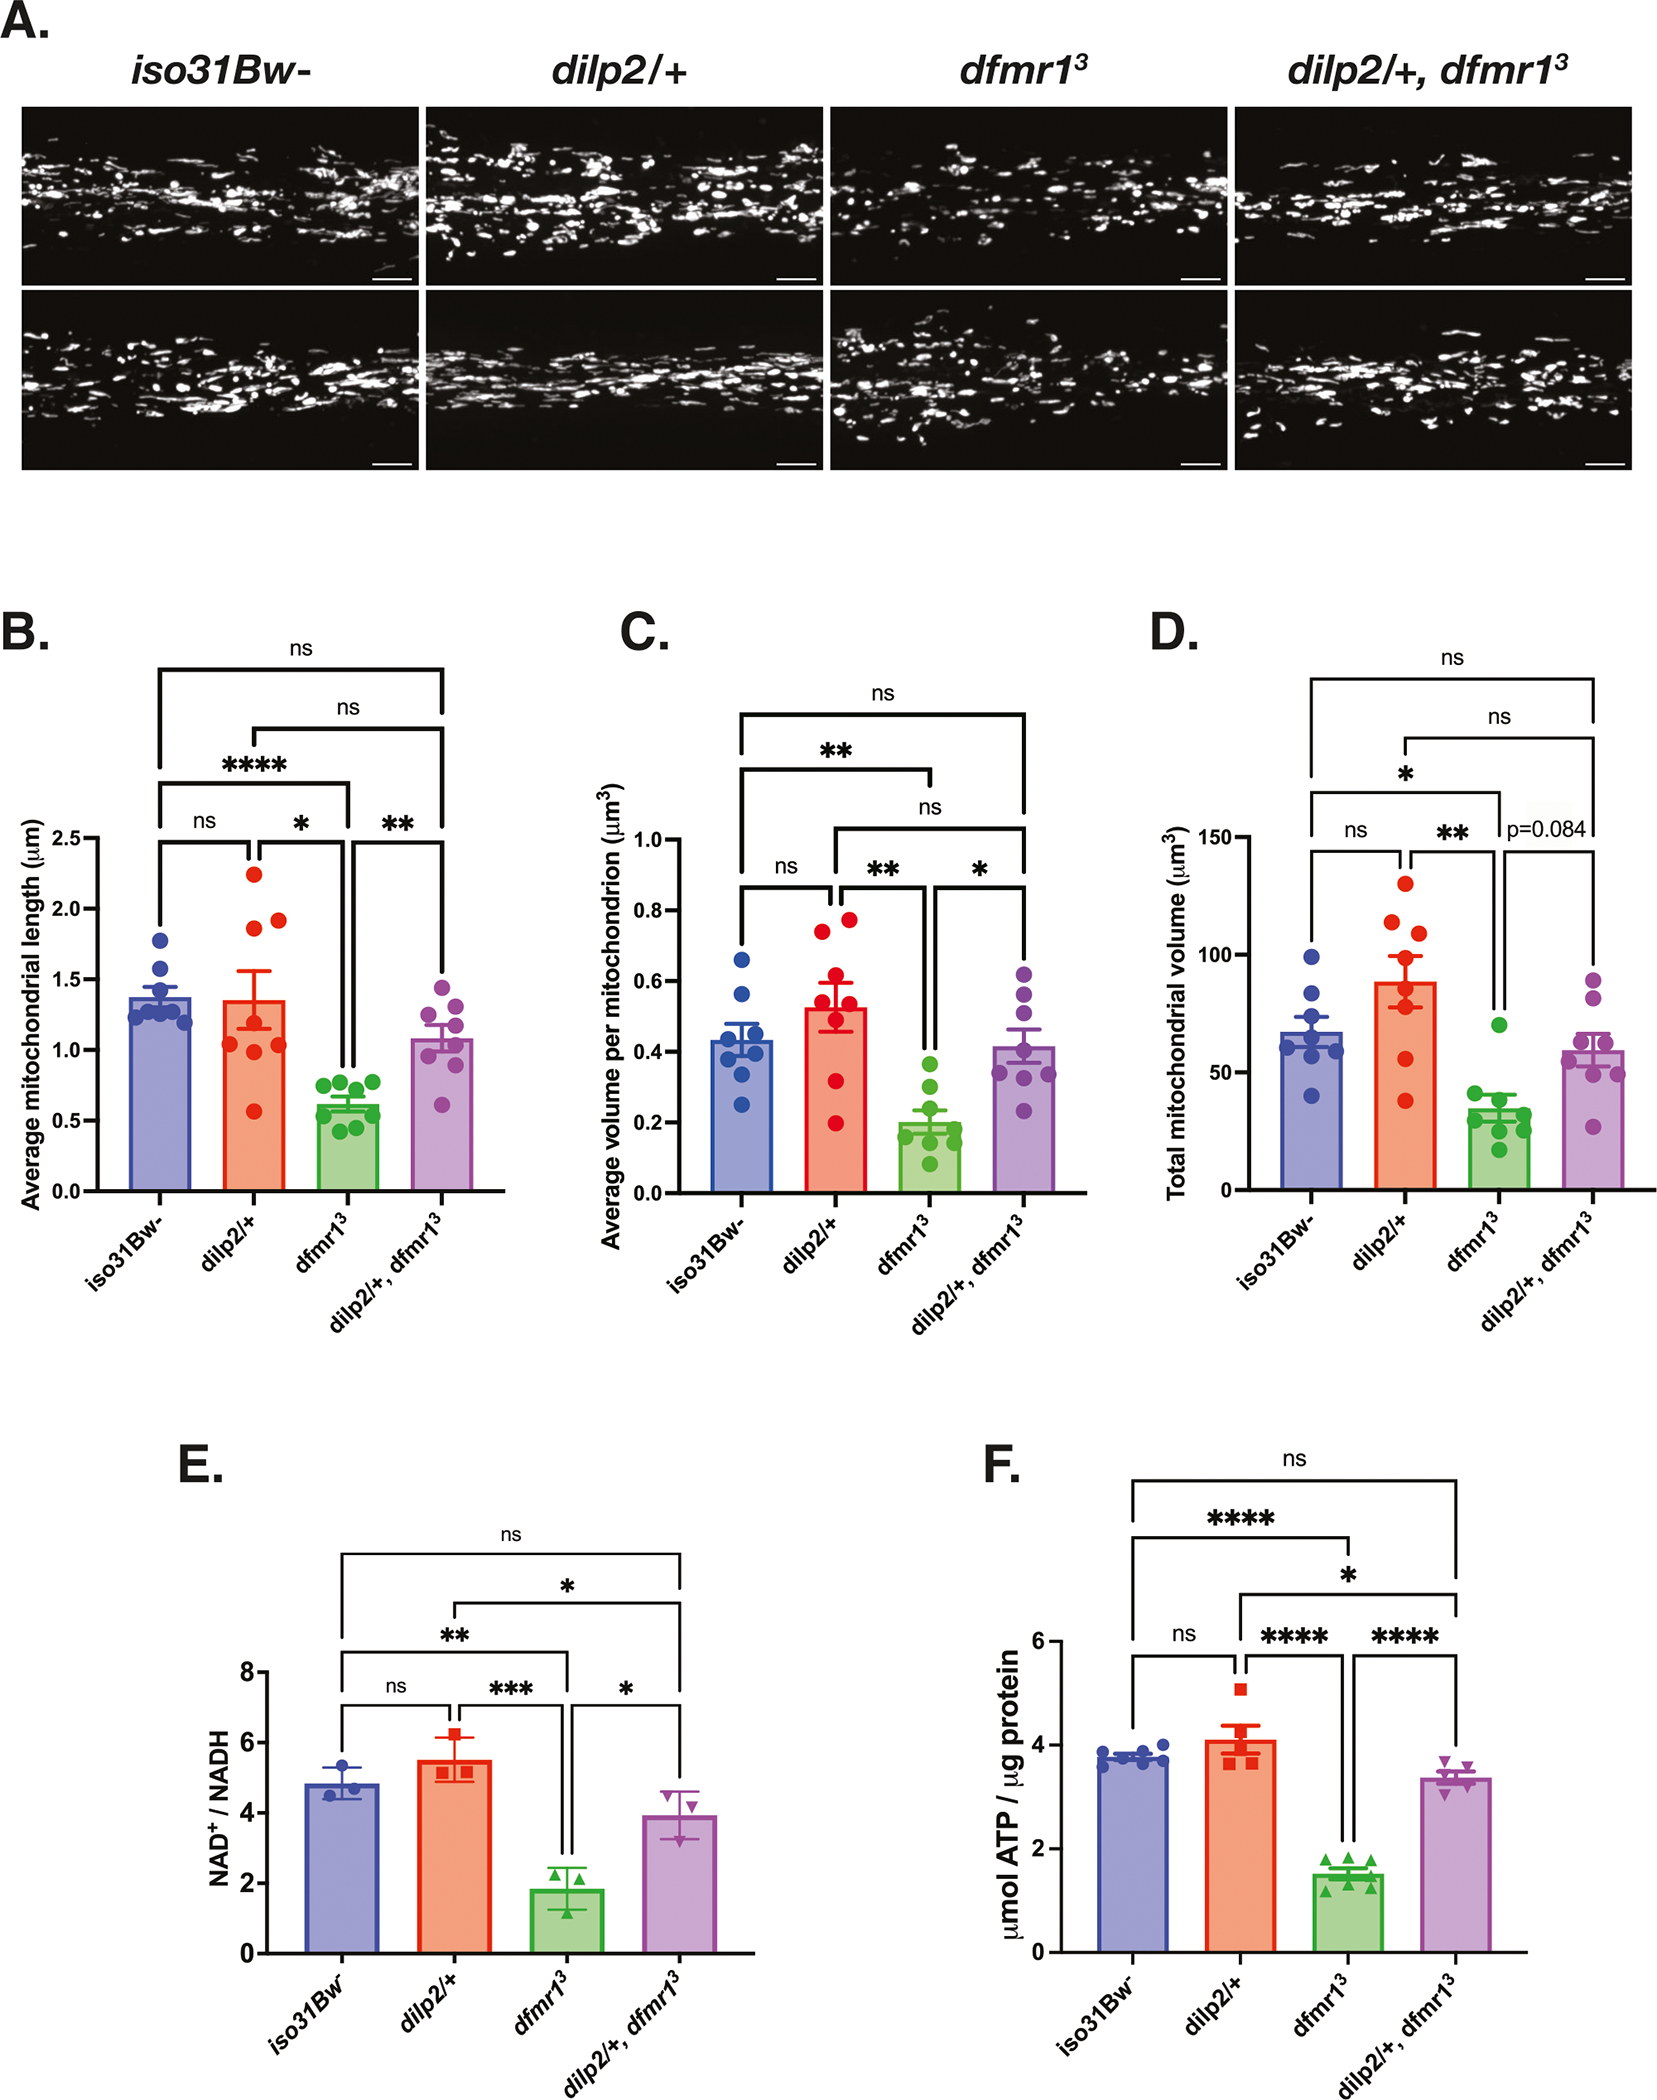
A–D Mitochondria in the insulin producing cells (IPCs) of the brain were labeled by expressing a genetically encoded UAS-mitoGFP construct in conjunction with the dilp2-Gal4 driver. A Two representative maximum-intensity projections of GFP-labeled mitochondria in the IPC processes of iso31Bw- wild type, dilp2/+ heterozygous mutant, dfmr1 homozygous mutant, and dilp2/+, dfmr1 double mutant flies. Scale bars: 5 μm. Images are oriented with the dorsal side on the left and the ventral side on the right. Sample number (N) per genotype = 8 brains. Brown-Forsythe and Welch ANOVA with Dunnet’s T3 multiple comparisons test revealed that genetic reduction of insulin signaling significantly improved (B) average mitochondrial length and (C) average volume per mitochondrion. D Total mitochondrial volume was not significantly increased in dilp2/+, dfmr1 double mutants, but showed a trend towards improvement (p = 0.084). Values represent mean ± SEM. *p ≤ 0.05, **p ≤ 0.01, ***p ≤ 0.001, ****p < 0.0001. (E) Quantification of the NAD+/NADH ratio.. Each sample contained 10 fly bodies. Sample number (N) per genotype = 3. One-way ANOVAs revealed a significant group effect for the NAD+/NADH ratio (p = 0.0003). Post hoc Tukey tests indicated that while dfmr1 mutant flies had a significantly lower NAD+/NADH ratio than their iso31Bw- and dilp2/+ heterozygous mutant conspecifics, dilp2/+,dfmr1 double mutant flies had a significantly improved NAD+/NADH ratio. Values represent mean ± SEM. *p ≤ 0.05, **p ≤ 0.01, ***p ≤ 0.001. F Quantification of ATP levels relative to protein content. Each sample contained 5 fly bodies. Sample number (N) per genotype: iso31Bw- = 6, dilp2/+ = 5, dfmr1 = 6, dilp2/+, dfmr1 = 5. One-way ANOVAs revealed a significant group effect for ATP levels (p < 0.0001). Post hoc Tukey tests indicated that while dfmr1 mutant flies had a significantly lower ATP levels than their iso31Bw- and dilp2/+ mutant conspecifics, dilp2/+,dfmr1 double mutant flies had a significant boost in ATP levels. Values represent mean ± SEM. *p ≤ 0.05, ****p ≤ 0.0001.