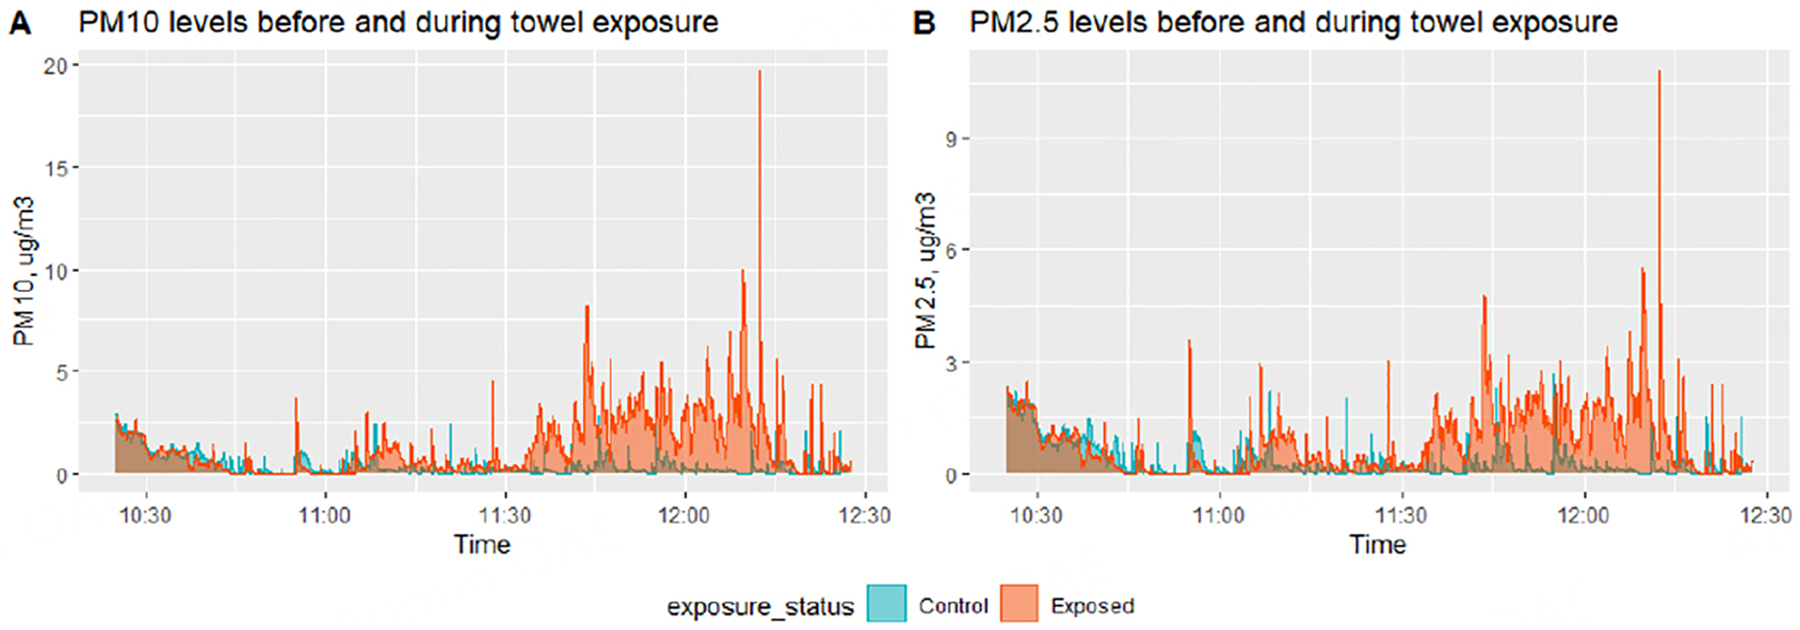
Figure 2.

Time series plots of real-time PM10 (A) and PM2.5 (B) measurements taken during one of the experimental periods. Real-time samplers were turned on but programmed to start logging data around 9:45am. Air samplers were placed side-by-side on a lab bench with one or two personnel working in the room. Towel samples were exposed to ENDS aerosols for one hour from ~ 9:45 am till ~ 10:45 am, while controls were kept in an airtight Ziplock bag. Then, ENDS-contaminated towels were also placed in airtight Ziplock bags and transported to the vivarium by 11:15 am. New mouse cages were set up, and towels and samplers were placed in the cages before introducing the respective group of mice into the new cages by 11:25 am. Then, at approximately 12:25 pm, air samplers were turned off, mice were placed in their home cages and the towels were placed back into the Ziplock bags.
