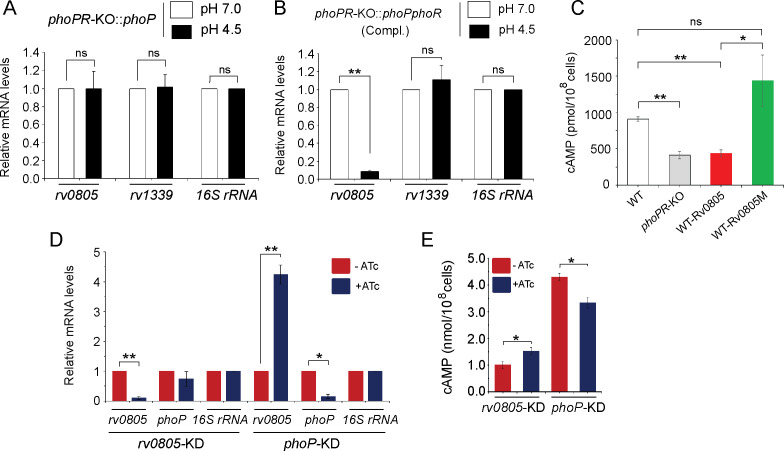
Figure 3. PhoP-dependent repression of rv0805 to maintain mycobacterial 3′,5-cyclic adenosine monophosphate (cAMP) level requires the presence of PhoR.
(A, B) To determine the impact of PhoR (the cognate sensor kinase of PhoP), expression of rv0805 was compared in indicated M. tuberculosis H37Rv strains: (A) phoPR-KO::phoP (phoPR mutant complemented with phoP) and (B) phoPR-KO::phoPR (phoPR mutant complemented with phoP-phoR) under normal and acidic conditions of growth. As expected, phoPR-KO::phoPR (Compl.) shows a significant repression of rv0805 (but not rv1339) under acidic pH (***p<0.001). However, rv0805 expression remains comparable in phoPR-KO::phoP under normal as well as acidic conditions of growth. As a control, rv1339 fails to show a variable expression in indicated mycobacterial strains. (C) To determine the effect of ectopic expression of rv0805 on intra-mycobacterial cAMP level, WT and mutant Rv0805 proteins (Rv0805M, defective for phosphodiesterase activity) were expressed in M. tuberculosis H37Rv (to construct WT-Rv0805, and WT-Rv0805M, respectively) as described in ‘Materials and methods’. Similar to phoPR-KO, WT-Rv0805 (but not WT-Rv0805M) showed a considerably lower level of cAMP relative to WT bacteria. Significance in variation of cAMP levels was determined by paired Student’s t-test (*p<0.05; **p<0.01). (D, E) Relative expression of phoP and PDE in phoP-KD and rv0805-KD (phoP and rv0805 knockdown constructs, respectively). In keeping with elevated expression of rv0805 in phoPR-KO, phoP-KD shows an elevated expression of rv0805 relative to WT bacilli. In contrast, phoP expression level remains unaffected in rv0805-KD mutant. Panel (E) measured corresponding intra-bacterial cAMP levels in the respective knockdown mutants, as described in the legend to Figure 1A.


