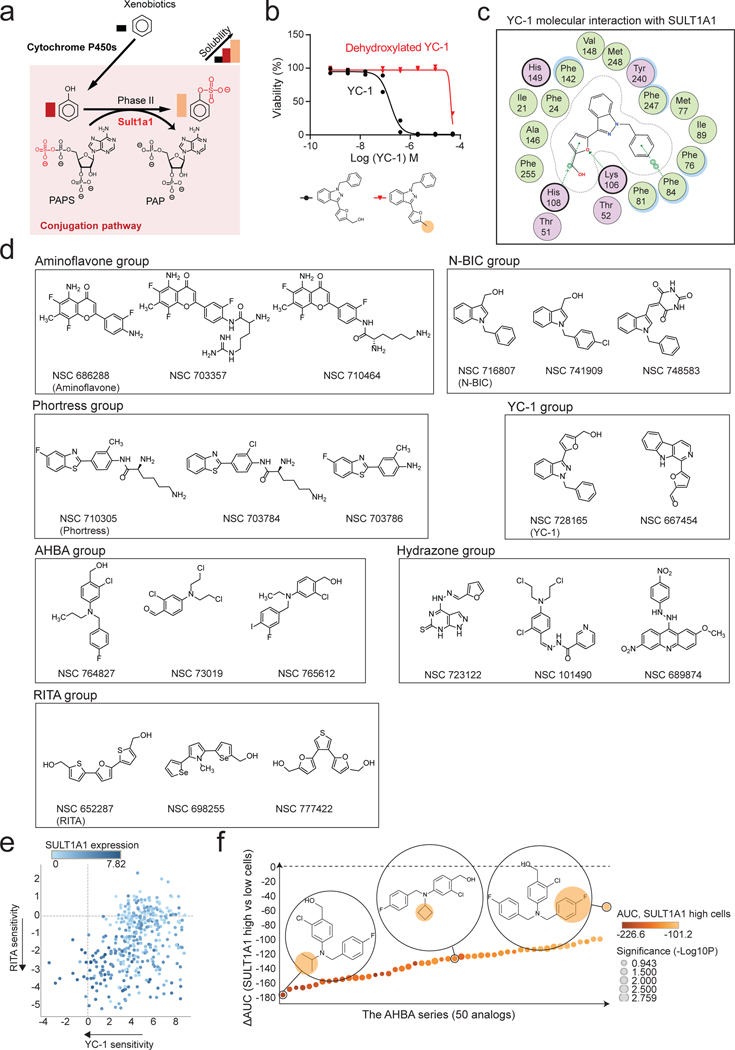
Extended Data Figure 5. Benzyl alcohol moiety determines YC-1 toxicity and defines a class of SULT1A1-activatable compounds.
a, Schematic of SULT1A1-mediated sulfonation reaction in modulating xenobiotic solubility. b, Response of RBE cells (IC50) to parent YC-1 or dehydroxlated analog. Two biologically independent experiments are shown. c, Computational modeling showing 2-dimentional depiction of YC-1 molecular interactions with amino acid residues within SULT1A1 catalytic site. Serves as supporting data for Fig. 4c. d, Exemplar compounds of each chemical group identified from the NCI-60 database as having activity profiles similar to YC-1. e, Scatter plot showing correlation between YC-1 and RITA sensitivity profiles across 398 cancer cell lines. Relative SULT1A1 mRNA levels are depicted by the color scheme. f, Graph showing the ranked activity of AHBA series compounds in terms of differential sensitivity toward SULT1A1-high cells (RBE and SNU1079) versus SULT1A1-low cells (SSP25 and CCLP1) (y-axis). The color code represents the average sensitivity (AUC) of SULT1A1-high cells to each analog. Bubble sizes denote significance (p-value). Significance was analyzed using two-tailed Student’s t-test. P < 0.05 was considered statistically significant.

