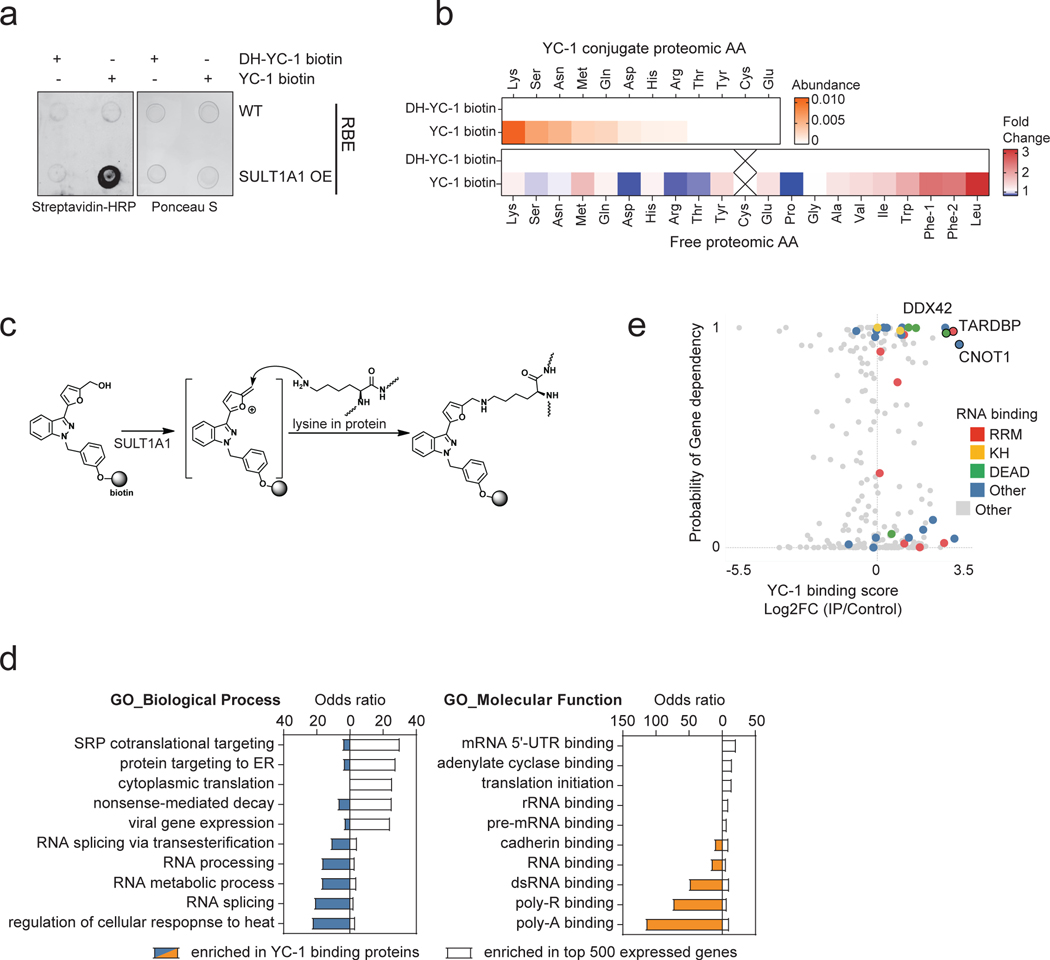
Extended Data Figure 6. Proteomic identification of YC-1 binding targets.
a, Dot blot of protein lysates from RBE parental cells (WT) RBE cells overexpressing SULT1A1 were treated with YC-1 biotin or DH-YC-1 biotin. Blots were probed with HRP-conjugated streptavidin (left). Ponceau S staining serves as the total protein loading control (right). b, Proteins extracted from RBE cells treated with YC-1 Biotin or DH-YC-1 Biotin were subjected to streptavidin affinity purification, digested to single amino acids, and analyzed by mass- spectrometry. Top: Heat map representing YC-1-conjugated amino acids. Bottom: Heat map representing amino acids not conjugated to YC-1 and serving to illustrate relative amino acid content of the purified proteins. c, Schematic of the predicted electrophilic reaction between sulfonated YC-1 biotin and lysine residue in proteins. d, Bar chart of odds ratios of enriched Gene Ontology classes among YC-1 binding proteins (bars to the left) in comparison to those from the most expressed 500 genes in RBE cells (bars to the right). e, Scatter plot of specific YC-1 binding score (x-axis) and probability of gene dependency from the Broad DepMap (y- axis) of YC-1 binding proteins. In (e), color code indicates proteins with common RNA binding domains identified by EnrichR analysis.

