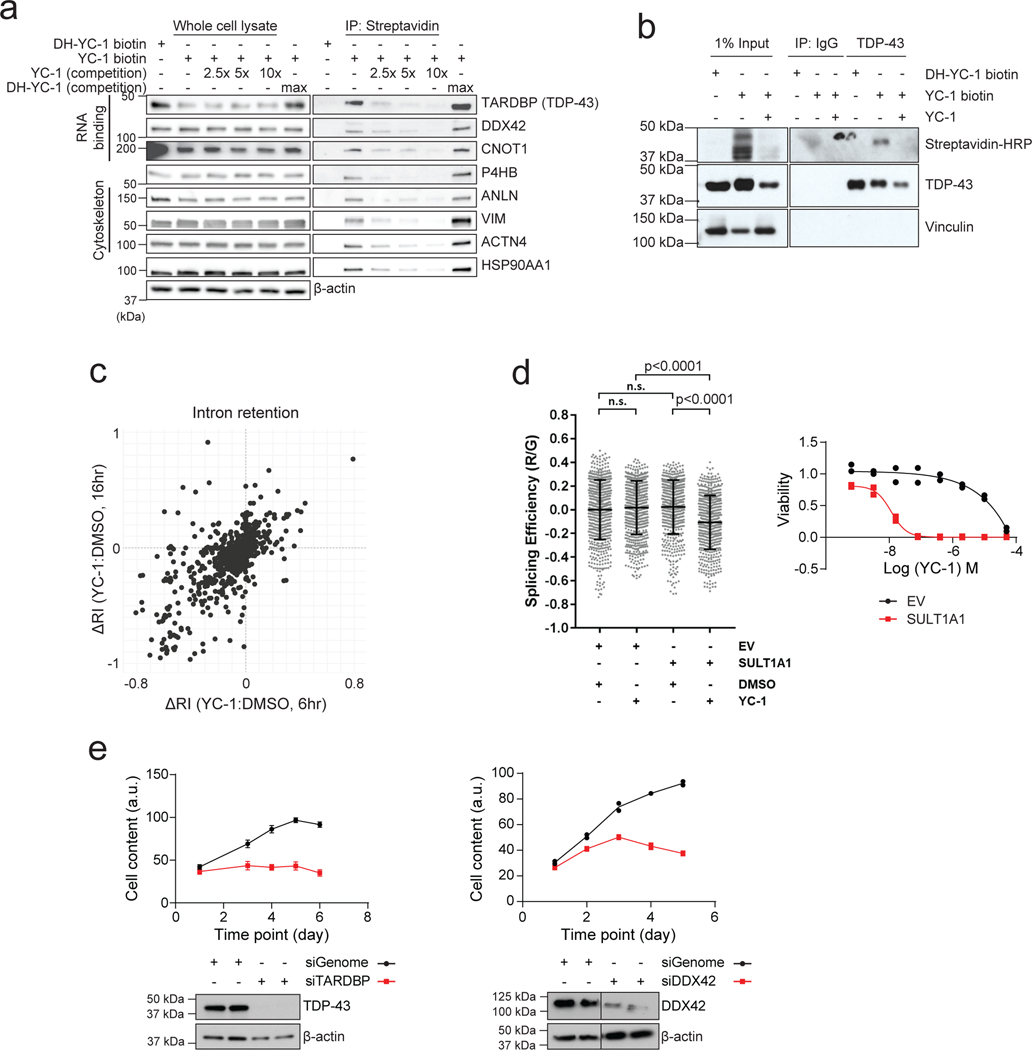
Extended Data Figure 7. YC-1 covalently binds RNA processing factors and influences RNA splicing.
a, Immunoblot from streptavidin affinity purification validating YC-1 binding proteins. RBE cells were treated with YC-1 biotin or DH-YC-1 biotin control in the presence of excess non- biotinylated YC-1 or DH-YC-1 as indicated. Left: Expression of candidate YC-1 binding proteins in whole cell lysates. Right: Immunoblot after Streptavidin capture, showing dose-dependent competition by parent YC-1. b, Immunoblot from TARDBP immunoprecipitation validating direct YC-1 binding. RBE cells were treated as in (a). The immunoblots (a, b) were performed two times with similar results. c, Scatter plot of genes with altered intron retention identified from RNA-seq analysis of RBE and SNU1079 cells treated with YC-1 or vehicle for 6 and 16 hours. N = 3 biological replicates per condition. ΔRI is the intron retention score calculated by the SALMON software package. d, Left, a TARDBP splicing efficiency assay assessing SULT1A1 dependent YC-1 impact on TARDBP RNA splicing activity. 293T cells exogenously expressing SULT1A1 or empty vector were transiently transfected with the reporter module containing plasmid and treated with YC-1 or DMSO vehicle and analyzed by fluorescent confocal microscope with GFP (G) and mCherry (R) laser. Statistical significance annotated between individual conditions (Welch unpaired t-test). n=3 biologically independent experiments with cells from two independent images per experiment included (>500 cells in total). “n.s.” denotes not significant. Right, YC-1 sensitivity assay confirming stable SULT1A1 expression. Two biologically independent experiments are shown. e, siRNA targeting TARDBP (left) or DDX42 (right) reduced target protein expression and cell number monitored for 5–6 days post transfection. Error bars in left panel are mean ± SD. Data shown were from one of the two performed experiments with similar results.

