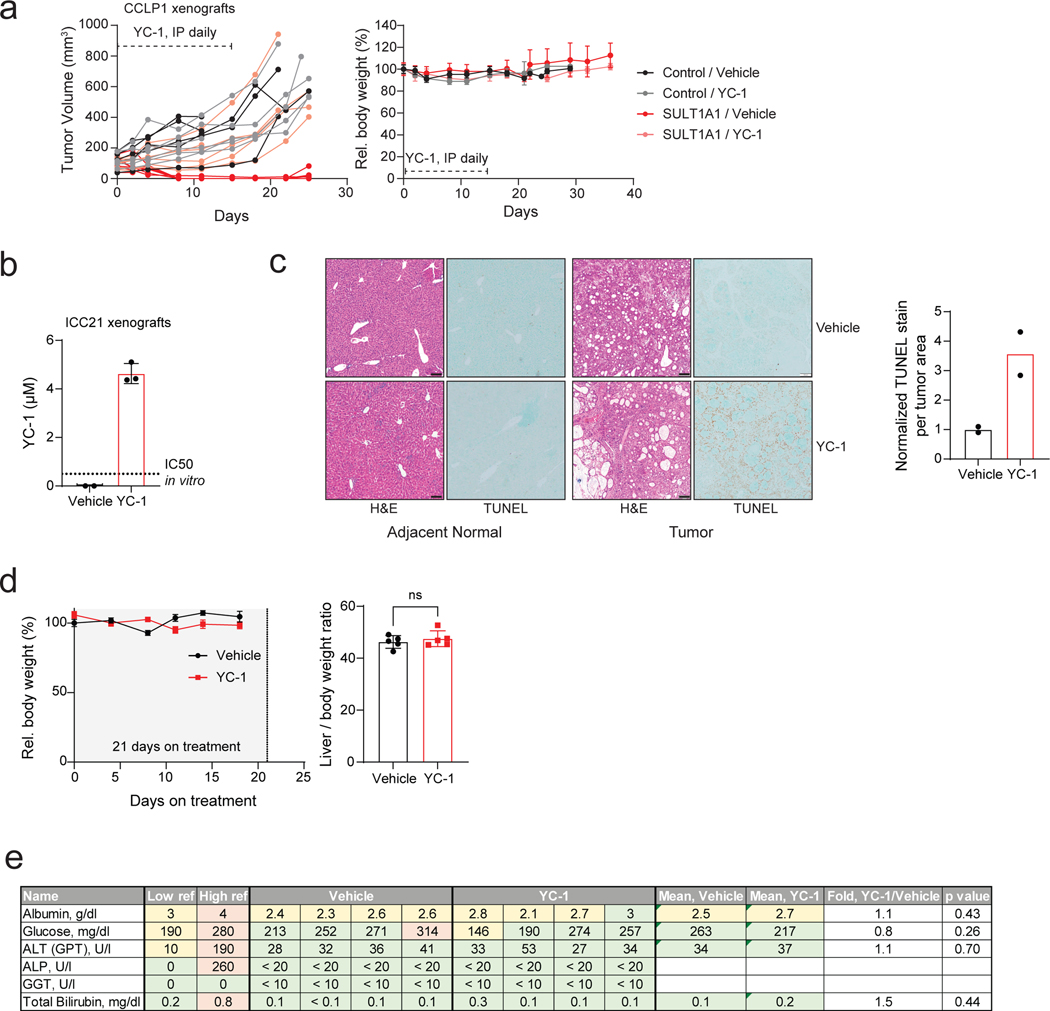
Extended Data Figure 8. SULT1A1 determines YC-1 efficacy in vivo.
a, SULT1A1-positive and SULT1A1-negative (Control) CCLP1 cells were implanted subcutaneously into NSG mice. Once tumors reached ~100 mm3, mice were treated with YC-1 (50 mg/kg) or vehicle for 14 days. Mice were then monitored for disease progression in the absence of treatment. Left: Graph of individual serial tumor volumes. These data are presented in the form of mean volumes in Figure 6b of the main figures. Right: Serial changes in body weight. Error bars are mean ± SEM. n=5–6 independent animals per group. b-e, Study of SULT1A1-high expressing ICC21 xenografts in response to YC-1 treatment. b, YC-1 concentration was assayed with three independent ICC21 xenograft tumor samples with YC-1 or vehicle treatment by mass spectrometry. Dashed line marks the in vitro ICC21 sensitivity to YC-1 treatment (IC50). Error bars are mean ± SD. n=3 independent samples per group. c, Tissue sections of ICC21 orthotopic tumors (middle panels) and adjacent normal (left panels) subjected to H&E and TUNEL staining. TUNEL staining was quantified in graph at the right and two independent animals per group are shown. Scale bar, 100 μm. d, Serial changes in body weight (left) were monitored for three weeks for subcutaneous tumor-bearing mice on YC-1 treatment and the liver and body weight ratios (right) were recorded at the euthanization point. Error bars are mean ± SEM. n=5 independent animals per group, two-tailed, unpaired Student’s t-test. e, table displaying plasma markers indicative of liver function from vehicle and YC-1 treated mouse plasma samples (p values derived by two-tailed, unpaired Student’s t-test).

