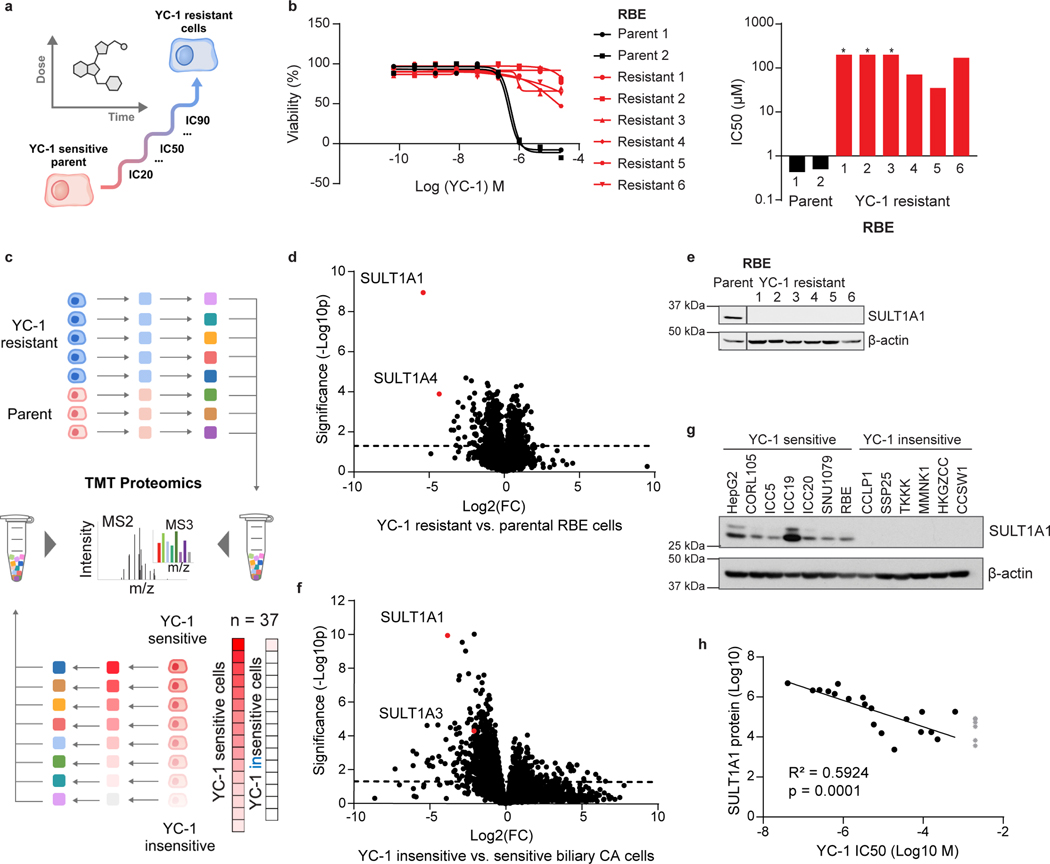
Figure 2. YC-1 sensitivity correlates to SULT1A1 expression levels.
a, Schematic of acquired YC-1 resistance experiment. b, Sensitivity (IC50) to YC-1 of parental RBE cells and acquired resistance models. IC50 curves (b) and computed values (c) are shown. Asterisk indicates IC50 too high to calculate based on (b). Graphs show means of technical replicates.
c, Schematic of TMT proteomics analysis of parental and YC-1-resistant RBE cells (upper portion, corresponds with panel [d]), and of a large panel of ICC cell lines (lower, corresponds with panel [f]). d, Volcano plot of proteomics data comparing parental and resistant RBE cell lines, highlighting significant depletion of SULT1A1 in resistant lines (two-tailed, unpaired Student’s t-test). e, Immunoblot validating SULT1A1 loss in resistant cells. Samples are from the same gel and exposure. The cropping removes an irrelevant lane. f, TMT proteomics comparing 5 YC-1-sensitive (IC50 median = 0.256 μM) and 32 YC-1-insensitive (IC50 median = 18.9 μM, not including cell lines with no response) biliary cell lines (two-tailed, unpaired Student’s t-test). g, Immunoblot for SULT1A1 in the indicated cell lines. Each is biliary, with the exception of HepG2 (HCC) and CORL105 (SULT1A1-high lung cancer). h, Graph of correlation between SULT1A1 protein levels and YC-1 IC50 across a set of 19 biliary tract cell lines. Asterisk indicates no response to YC-1. The linear regression line is shown. Immunoblots (e, g) were from one of the two performed experiments with similar results.

