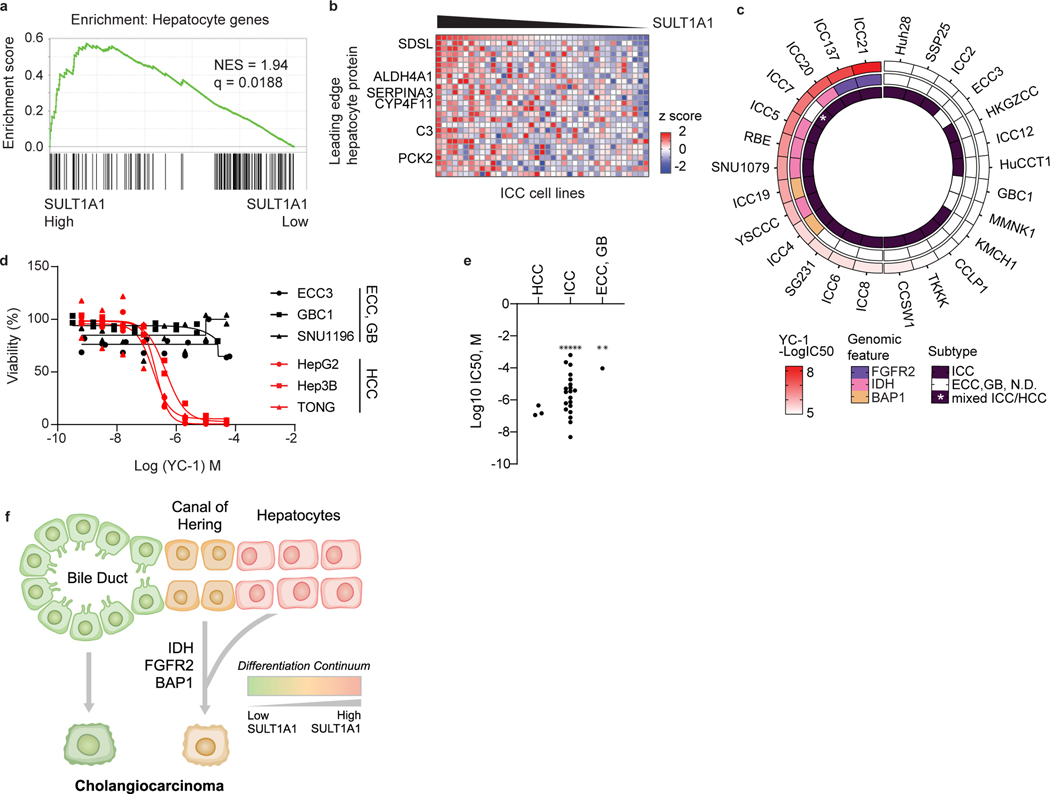
Figure 4. SULT1A1 expression associates with hepatocyte lineage.
a, b, GSEA (a) and heatmap (b) of hepatocyte protein expression in ICC cell lines according to SULT1A1 protein levels. Significance was calculated as false discovery rate by the GSEA package. Q < 0.25 was considered statistically significant. c, Circos plot of 28 biliary tract cell lines depicting YC-1 sensitivity, biliary cancer type, and specific molecular features (i.e., IDH1 mutation, FGFR2 fusion, and absence of BAP1 protein expression). Asterisk indicates mixed ICC/HCC histology. ECC, extrahepatic cholangiocarcinoma; GB, gallbladder carcinoma; N.D., normal duct. d, YC-1 sensitivity measurement in representative HCC, ECC, and GB cell lines. Two biologically independent experiments are shown. e, Scatter plot comparing YC-1 IC50s of cell lines between liver cancer subtypes. Asterisks indicate cell lines exhibiting no response to YC-1 (IC50 not calculable). f, Model relating SULT1A1 expression, liver lineage marker expression, and genomic alterations in ICC.

