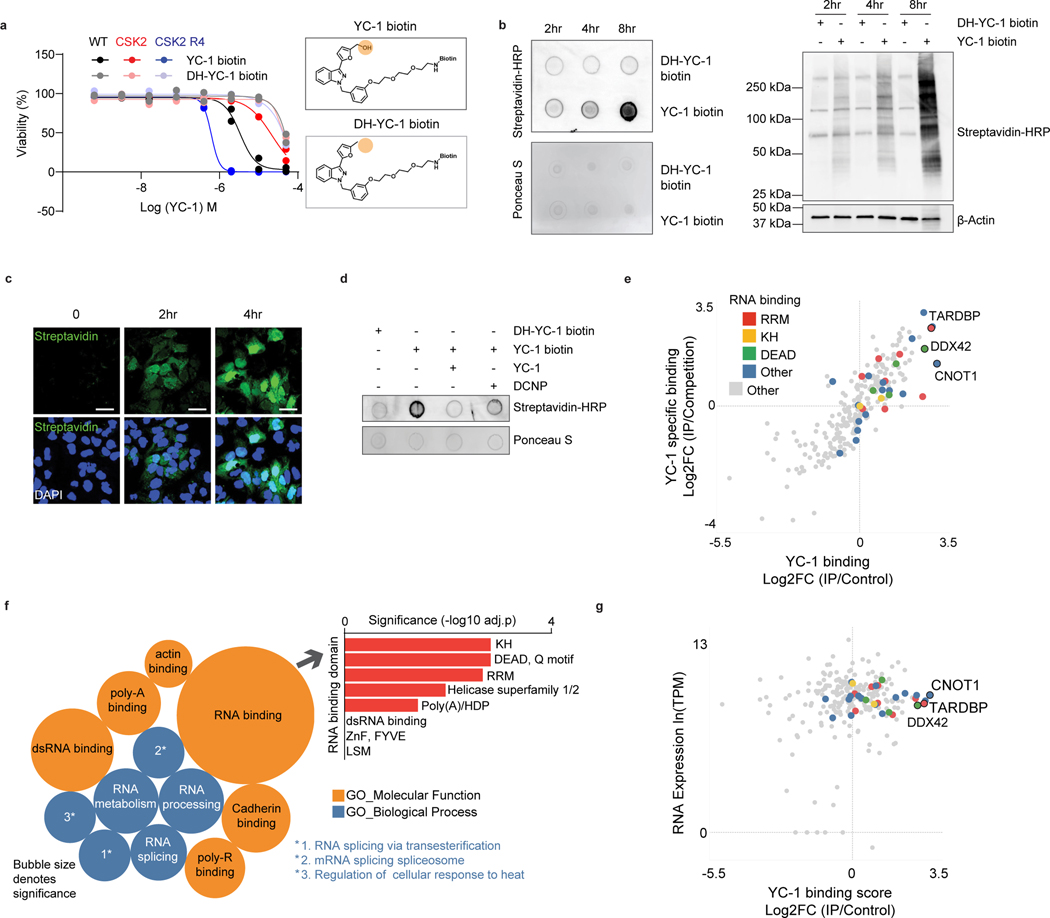
Figure 6. Proteomic identification of YC-1 binding targets.
a, Activity of YC-1 biotin and dehydroxylated (DH) YC-1 biotin against parental RBE cells and derivative lines with SULT1A1 KO (CSK2) and SULT1A1 KO with SULT1A1 re-expression (CSK2 R4). Two biologically independent experiments are shown. b, Dot blot (upper) and western blot (lower) of protein lysates from RBE cells treated with YC-1 biotin or DH-YC-1 biotin for the indicated times. Blots were probed with HRP-conjugated streptavidin. Ponceau S staining for dot blot and β-actin for western blot serve as the total protein loading control. c, Immunofluorescence images of RBE cells treated with YC-1 biotin. Fixed cells were stained with Streptavidin-FITC to detect YC-1 biotin and with DAPI for visualization of the nucleus. Scale bar, 17 μm. d, Dot blot of protein lysates of RBE cells treated as indicated for specificity and SULT1A1 dependency. e, Scatterplot of results of YC-1 pulldown proteins. Enrichment is revealed by binding to YC-1 biotin relative to dehydroxylated inactive YC-1 biotin control (x-axis) and YC-1 biotin binding competed by parent YC-1 (y-axis). Proteins with specific RNA binding domains are color coded. f, Bubble chart of YC-1 binding proteins displaying enrichments based on the Gene Ontology Molecular Function and Biological Process databases (See Methods). The bar graph (right) depicts enrichment among different classes of RNA binding domains. Significance was calculated as adjusted p value using two-sided Fisher’s exact test and the Benjamini-Hochberg method for correction for multiple hypotheses testing. Adjusted p value < 0.05 was considered statistically significant. Immunoblot and immunofluorescence in (b) and (c) were performed two times with similar results. g, Graph showing correlation between specific YC-1 binding score for proteins detected in YC-1 pull-downs and mRNA expression of the associated gene. In (e and g), color code indicates proteins with common RNA binding domains identified by EnrichR analysis.

