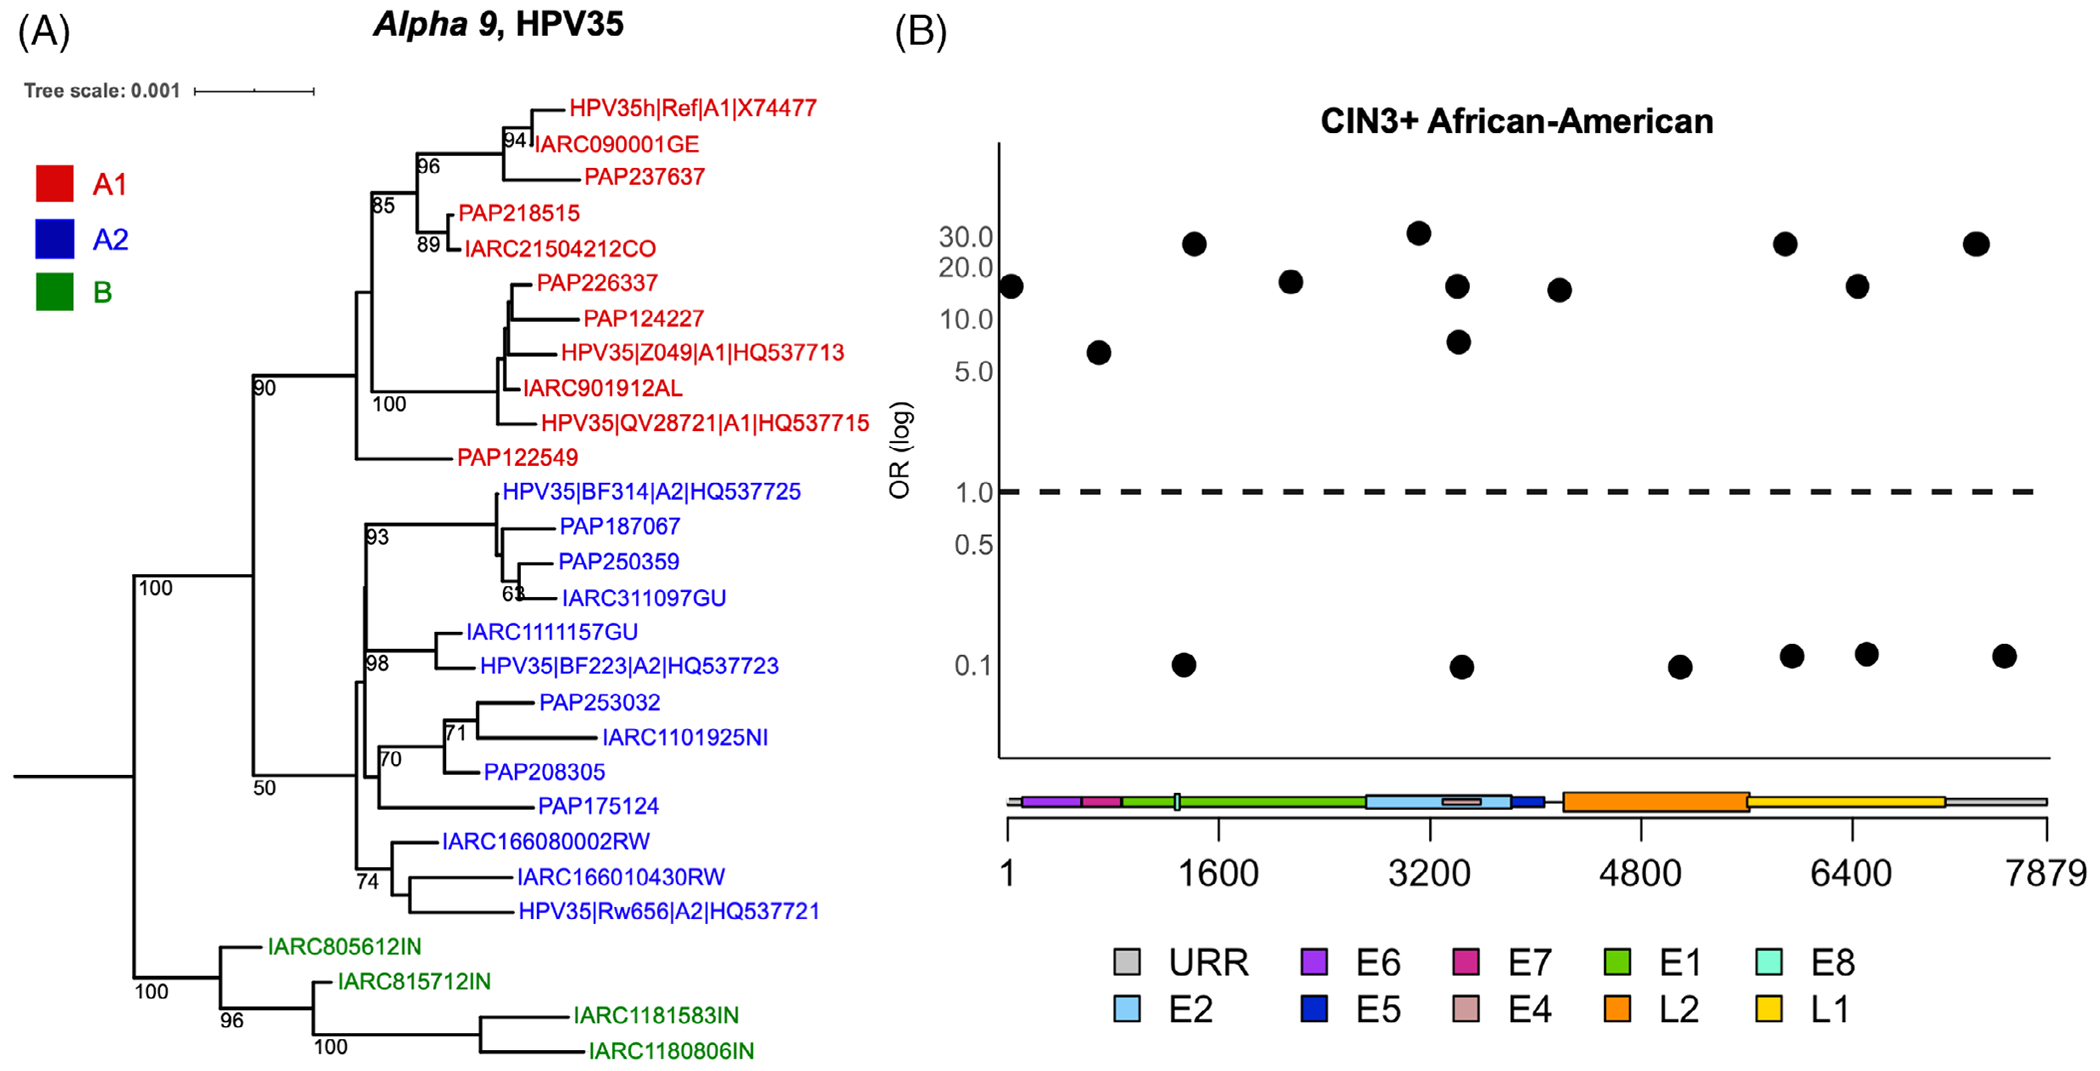
FIGURE 1.

Phylogenetic tree illustrating HPV35 lineages, and individual SNPs across the HPV35 genome associated with CIN3+ in African-American women. A, HPV35 complete genome tree topology. The maximum likelihood (ML) tree was constructed using RAXML from a global alignment of complete HPV35 genome nucleotide sequences from the Persistence and Progression (PaP) Cohort and IARC samples, as well as reference sequences,29 bootstrap support values equal to or higher than 50 are shown on or near branches. HPV31 was used as an outgroup taxon to root the tree (not shown). Distinct variant lineages (ie, termed A and B) and sublineages (eg, termed A1 and A2) were inferred from the tree topology. The bar indicates the nucleotide substitutions per unit change (ie, 0.001) per site. B, SNPs significantly associated with CIN3+ among African-American women in the PaP Cohort. Odds ratios (OR) are shown on the y-axis and HPV35 genome positions by viral gene regions are shown on the x-axis. Circles represent variants significantly (P < .05) associated with CIN3+ compared to other nucleotide at the same genomic position. For details, see Table S4
