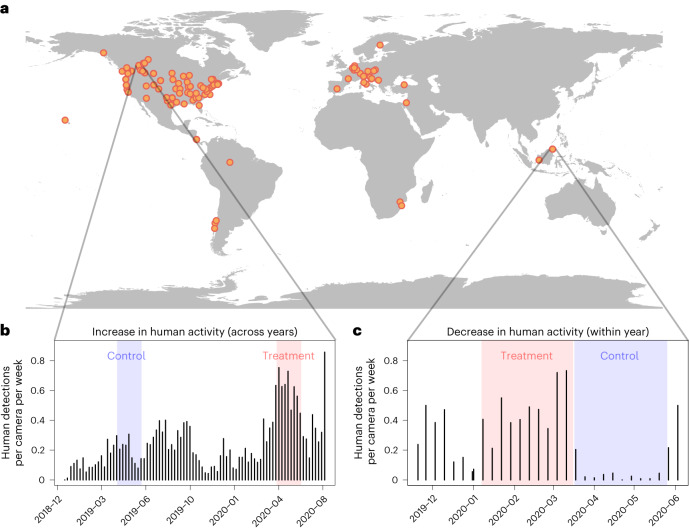
Fig. 1. Camera-trap sampling of contrasts between periods of higher versus lower human activity.
a, Location of camera-trap projects included in the analysis (n = 102). b,c, Examples for two projects: Edmonton, Canada (b) and Danum Valley, Malaysia (c) showing time series of human detections for the two types of comparisons used to assess the effects of higher human activity on animals. b, A between-year comparison with increased human activity during the COVID-19 pandemic (treatment, red shading) relative to the same time period the year before (control, blue shading). c, A within-year comparison with decreased human activity during the pandemic (control, blue shading) relative to the prepandemic period (treatment, red shading).

