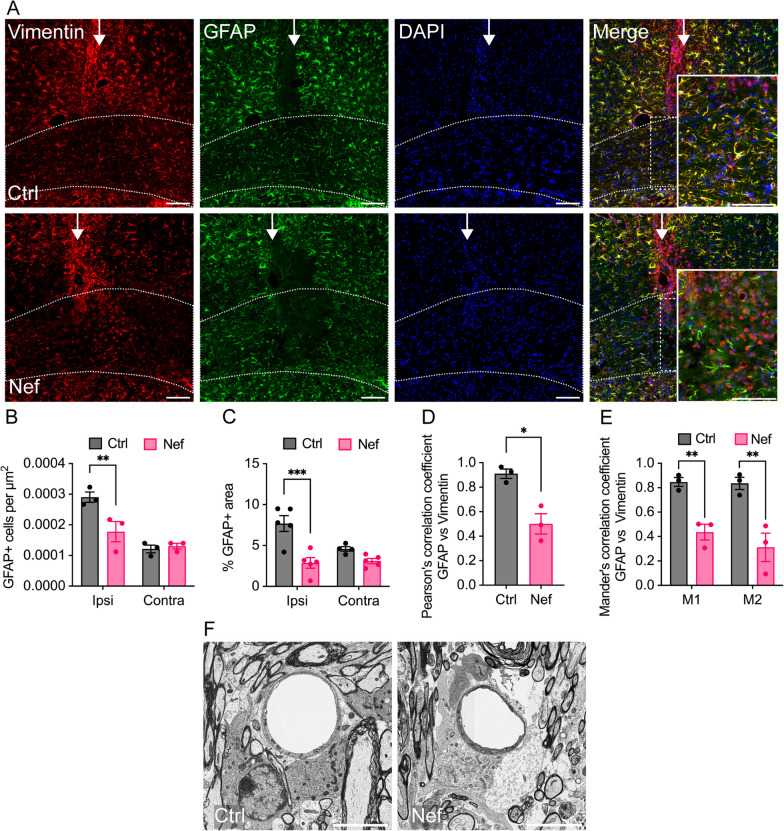
Fig. 2.
Effects of Nef EVs on astrocytes in vivo. Mice were intracranially injected with either Ctrl or Nef EVs. At 3 days post injection, brain tissue was processed for analysis using immunohistochemistry (IHC) or scanning electron microscopy (SEM). The images display representative fields from the corpus collosum at the injection site. A Representative fluorescence images of vimentin (red), GFAP (green), and nuclei (DAPI). Higher magnification insets illustrate the loss of GFAP within the lesion area. B Quantification of GFAP + cells per µm2 within the ipsilateral (ipsi) and contralateral (contra) corpus callosum at the lesion. C Quantification of the percentage of GFAP + immunofluorescence area within the ipsilateral and contralateral corpus callosum at the lesion. D, E Analysis of colocalization of GFAP and vimentin within the ipsilateral corpus callosum at the lesion. M1: fraction of GFAP in the vimentin area, and M2: fraction of vimentin in the GFAP area. F Representative SEM images of perivascular astrocytes within the corpus callosum lesion. The white arrow indicates the injection site and the dotted line indicates the border of the corpus callosum. For IHC, n = 3–5 mice per group, scale bar is 100 µm. For SEM, scale bar is 5 µm. *p < 0.05; **p < 0.01; ***p < 0.001; ****p < 0.0001

