Fig. 3.
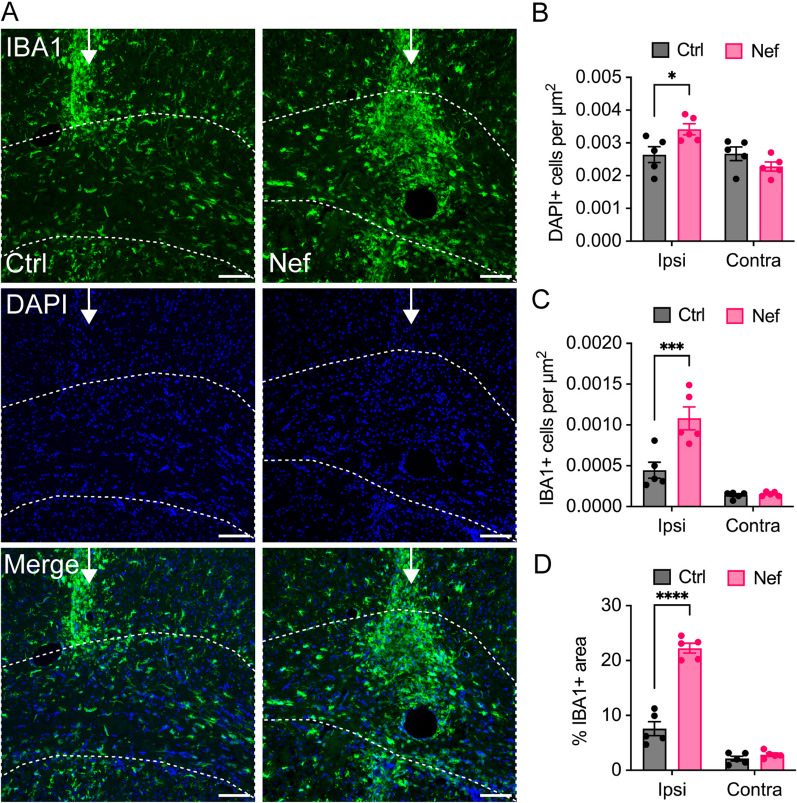
Effects of Nef EVs on microglia in vivo. Mice were intracranially injected with Ctrl or Nef EVs. At 3 days post injection, brain tissue was processed for analysis by immunohistochemistry. The images depict representative fields from the corpus collosum at the lesion site. A Representative fluorescence images of microglia/myeloid cells (IBA1, green) and nuclei (DAPI, blue). B Quantification of DAPI + immunofluorescence per µm2 within the ipsilateral (ipsi) and contralateral (contra) corpus callosum. C Quantification of IBA1 + cells per µm2 within2 the ipsilateral and contralateral corpus callosum. D Quantification of the percentage of IBA1 + immunofluorescence within the ipsilateral and contralateral corpus callosum at the injection site. N = 5 mice per group. The white arrow indicates the injection site and the dotted line indicates the border of the corpus callosum. For IHC, n = 5 mice per group, scale bar is 100 µm. *p < 0.05; **p < 0.01; ***p < 0.001

