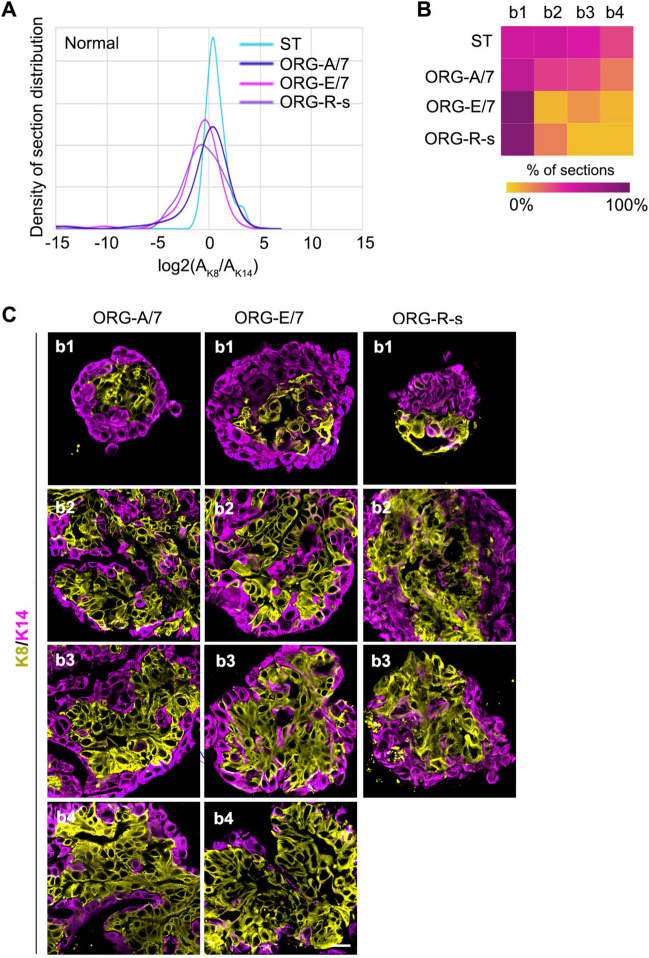
Fig. 2.
Probability density distribution is able to identify culture-induced phenotypic changes within the tissue. A The probability density distribution for starting tissue obtained from patients with a normal diagnosis and the resulting organoids cultured under various conditions. Base media was supplemented with AREG and FGF-7 (A/7), EGF and FGF-7 (E/7) or the R-spondin (R-S) media in which EGF was replaced with AREG (R-s). B Heat map showing the bin distribution for each culture condition. C Representative images from the bins associated with the culture conditions are shown. For A7 and E7 (N = 3 patients with > 87 organoid sections); (for R-S (N = 2 patients with 62 organoid sections). See Table 2

