Fig. 6.
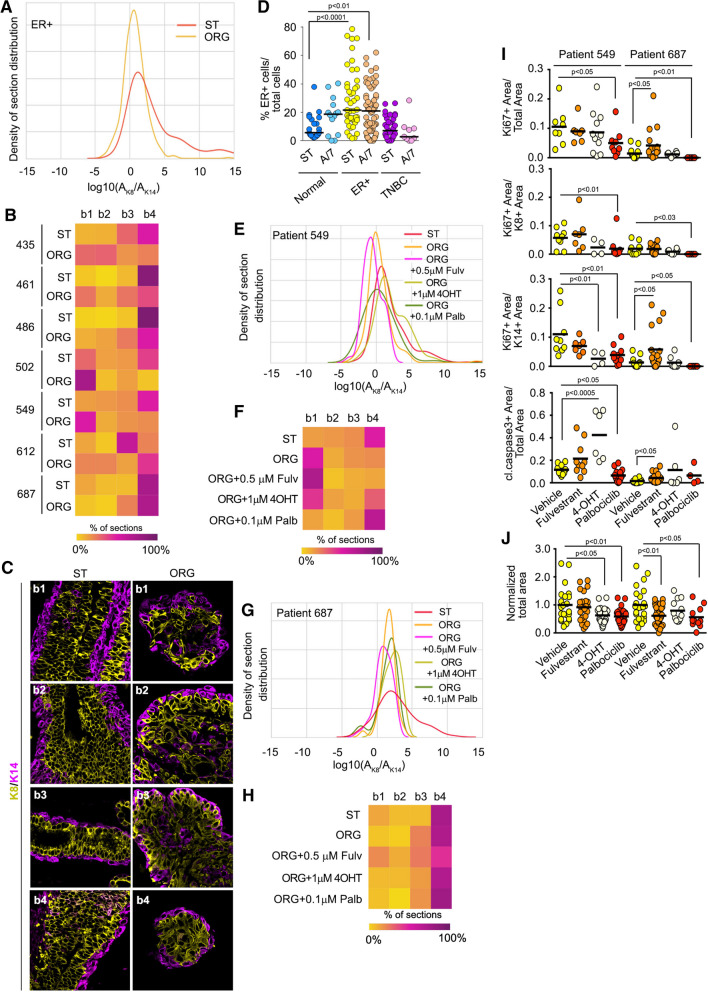
Luminal A/B tissue intra-tumor heterogeneity and drug responses. A The probability density distribution for luminal A/B starting tissue and the resulting organoids. B Heat map showing intra- and inter-tumor heterogeneity of all the starting tissue compared to the organoids generated from the tissue. C Representative images from ST and resulting organoids. D Luminal A/B tumor organoids recapitulate the expression of ERα observed in the starting tumor tissue. Data was obtained from ≥ 2 patients and ≥ 9 sections for each analysis. For patients 549 E, F and 687 G, H the probability density distribution and heat map analysis of starting tissue and their organoids treated with different chemotherapeutic treatments. I Tumor organoids identify differing proliferation and apoptotic responses to chemotherapeutic treatments. J Inhibition of tumor organoid area in response to chemotherapeutic treatments as measured by DIC. Area normalized to vehicle control for each patient. See Figures S5 and S6 and Tables 3 and 5 and S3

