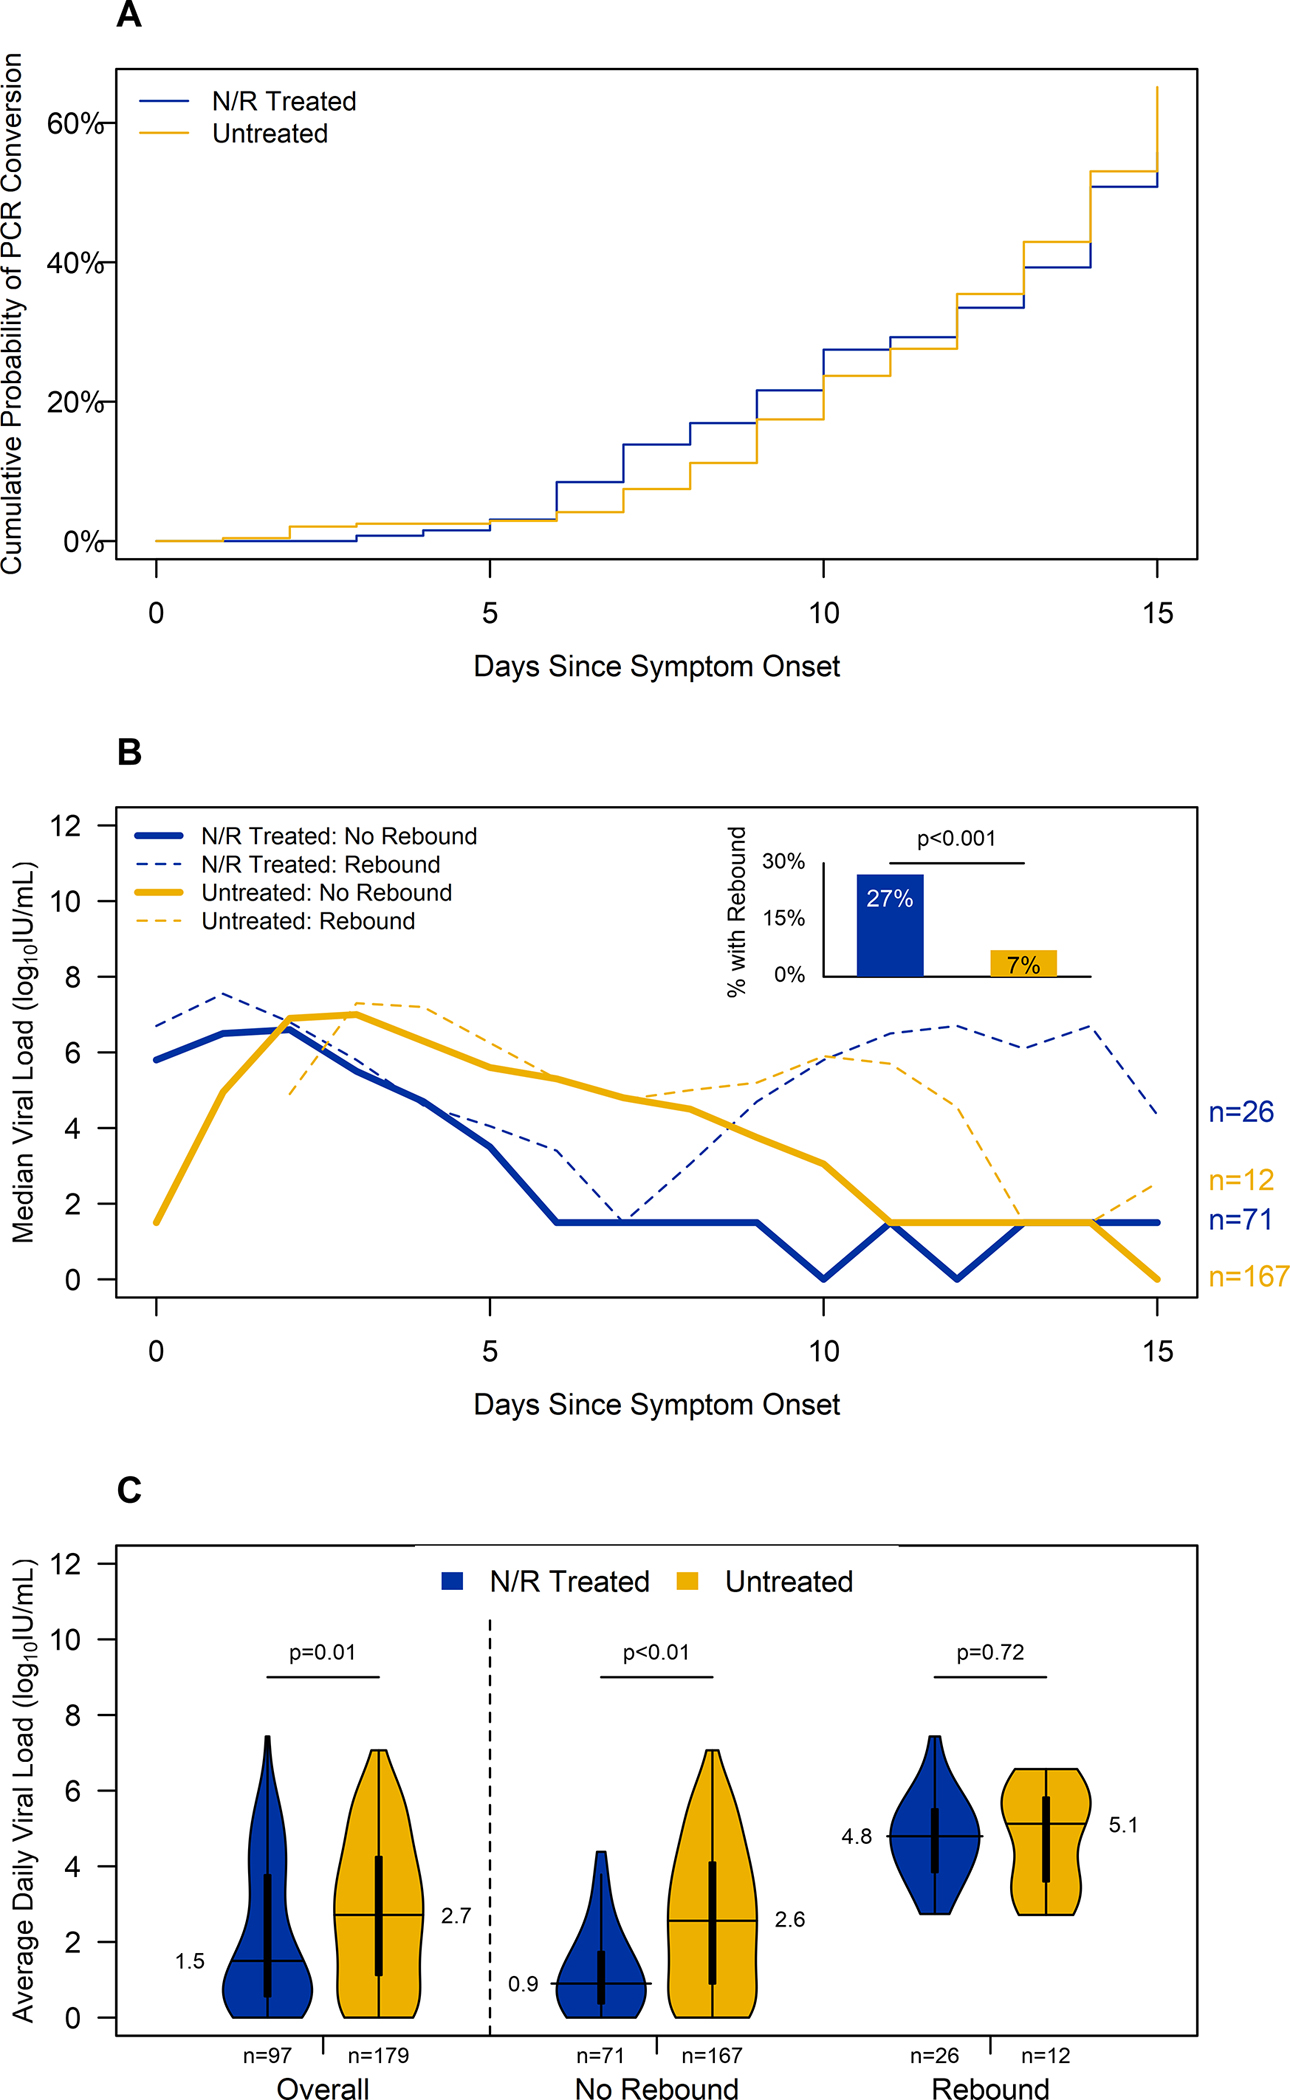
Figure 3. Viral dynamics during the first two weeks after symptom onset by nirmatrelvir/ritonavir treatment completion and viral load rebound1 visualized by (A) cumulative probability of RT-PCR conversion to negative2, (B) median viral load each day since symptom onset and proportion with viral load rebound, and (C) median of each participant’s average daily viral load after nirmatrelvir/ritonavir completion or seven days since symptom onset.

Footnote: N/R=nirmatrelvir/ritonavir;
1VL rebound was defined as an increase of at least 1 log10IU/mL for which the maximum VL exceeded 5 log10IU/mL after treatment completion/proxy;
2PCR conversion was defined as the first day in which a patient had a negative PCR result after which no additional positive results occurred.
