Fig. 1.
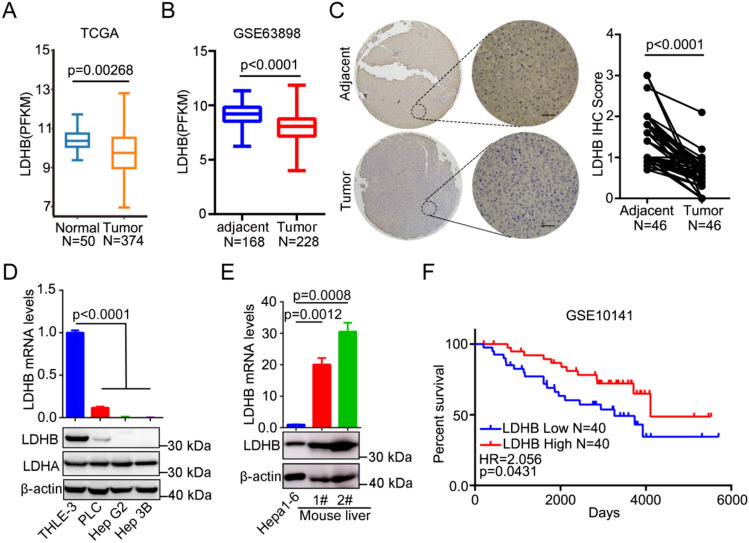
Down-regulation of LDHB in HCC tissues and cell lines, and correlation with poor overall survival in HCC patients. A, B LDHB expression levels in HCC and nontumor tissues in TCGA (Data from DNMIVD, http://119.3.41.228/dnmivd/index/) and GSE63898 databases. C Representative images and statistical analysis of LDHB IHC staining intensity in 46 paired HCC patient tissues. Scale bars, 25 μm. D LDHB expression levels were detected in human HCC cell lines PLC, HepG2, Hep3B by qRT-PCR and Western blot. The human liver epithelial cell line THLE3 was used as a control. E LDHB expression level was detected in mouse HCC cell line Hepa1-6 by Western blot and qRT-PCR. Mouse normal liver tissues were used as controls. F Kaplan–Meier OS curves for HCC patients with high or low LDHB levels in the GSE10141database

