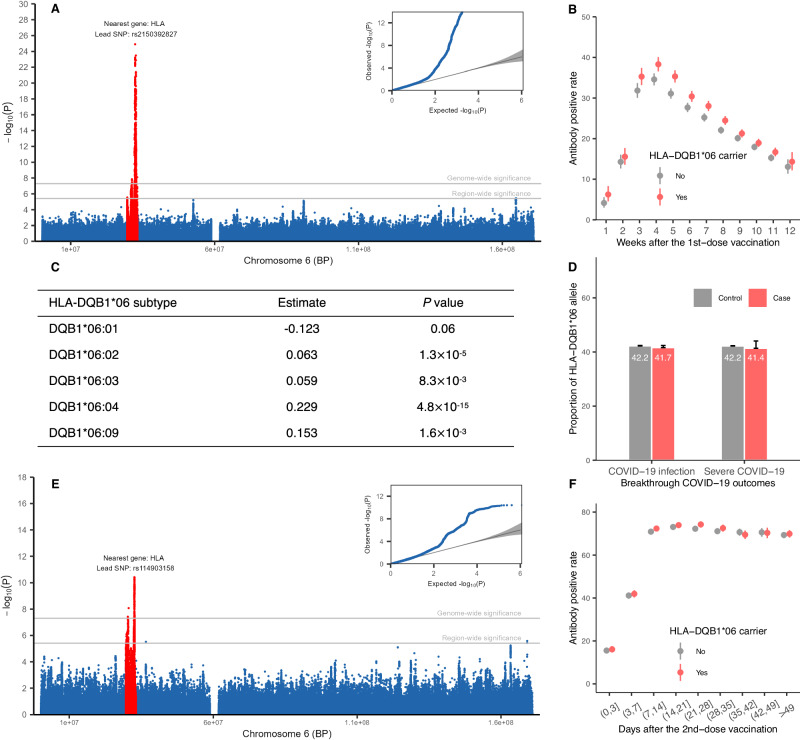
Fig. 2. Verification and extension of findings on HLA-DQB1*06 alleles.
A Manhattan plot of GWAS in chromosome 6 on antibody response to first-dose COVID-19 vaccine. SNPs within the MHC region are labelled in red colour, with the nearest gene to the lead SNP presented. The whole GWAS results are shown in Supplementary Fig. 1. B The proportion of individuals with a positive antibody response, stratified by the HLA-DQB1*06 status in the CS-first-dose cohort. Individuals with one or two DQB1*06 alleles are classified as carriers, whereas those with zero DQB1*06 alleles are non-carriers. C The association of five specific HLA-DQB1*06 subtypes with the antibody response. The estimate presents the coefficient of each allele in the logistic regression model. D The proportion of individuals carrying HLA-DQB1*06 alleles, comparing COVID-19 cases with controls (those not infected). Specific numerical data is labelled with white text within each bar. E Manhattan plot of GWAS in chromosome 6 on antibody response to second-dose COVID-19 vaccine. SNPs within the MHC region are labelled in red colour, with the nearest gene to the lead SNP. The entire GWAS results are shown in Supplementary Fig. 1. F The proportion of individuals with a positive antibody response, stratified by the HLA-DQB1*06 status in the CS-second-dose cohort. The error bars in panels B, D, and F indicate the two-sided 95% confidence interval without correcting for multiple testing. The P value of the Wald test in panels A, C and E is presented raw and did not correct for multiple testing. Source data are provided in the Source data file. The inset of the Manhattan plot on the left of the figure shows a Q–Q plot, with expected P values on the x-axis and observed P values on the y-axis.

