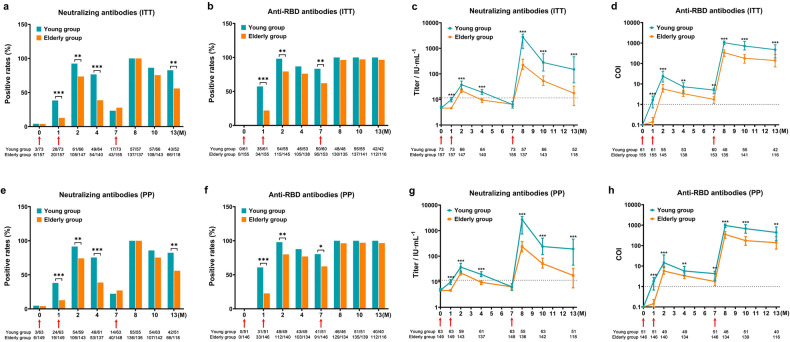
Fig. 3.
Positive rates and titers of neutralizing antibodies and anti-RBD antibodies. ITT analysis (a–d) and PP analysis (e–h) to illustrate antibody fluctuation trends. P values are shown only for significant differences, *P < 0.05, **P < 0.01, ***P < 0.001. Notes below each figure represented the number of participants tested at each sampling point and participants with positive test results. Red arrows indicated time points of vaccination. Dot lines represented the threshold of antibodies

