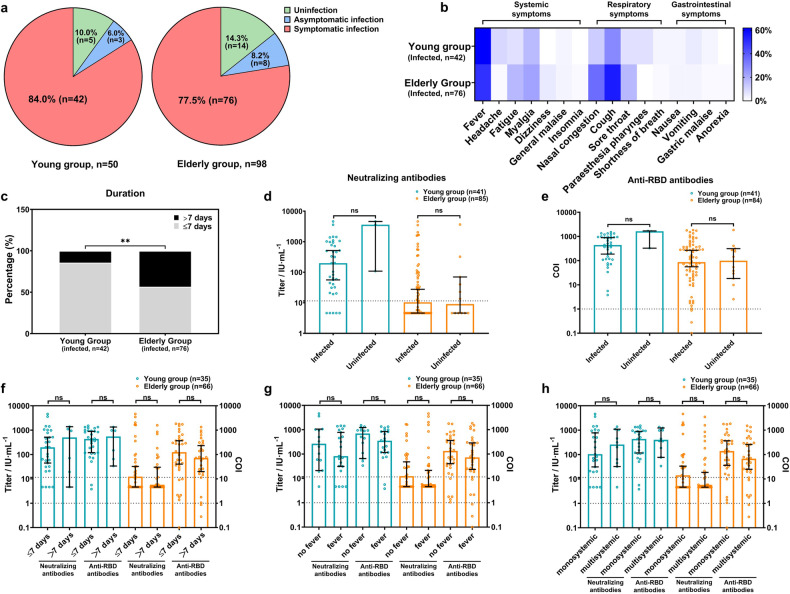
Fig. 4.
The relationship between breakthrough infection rates or symptoms and pre-infection antibody levels. The information on the breakthrough infection (a), the symptom types (b), and the symptom durations (c) were collected from 50 young and 98 elderly participants in the cohort. The association between pre-infection antibodies and infection status is presented in (d) and (e), whereas the relationship between pre-infection antibodies and symptoms is depicted by durations (f), accompanying fever (g), and symptom complexity (h) (monosystemic symptoms: only systemic, respiratory, or gastrointestinal symptoms; multisystemic symptoms: at least two of those three above). Data were analyzed using the chi-square test and Mann–Whitney U test. **P < 0.01. ns no significance. Dot lines represented the threshold of antibodies

