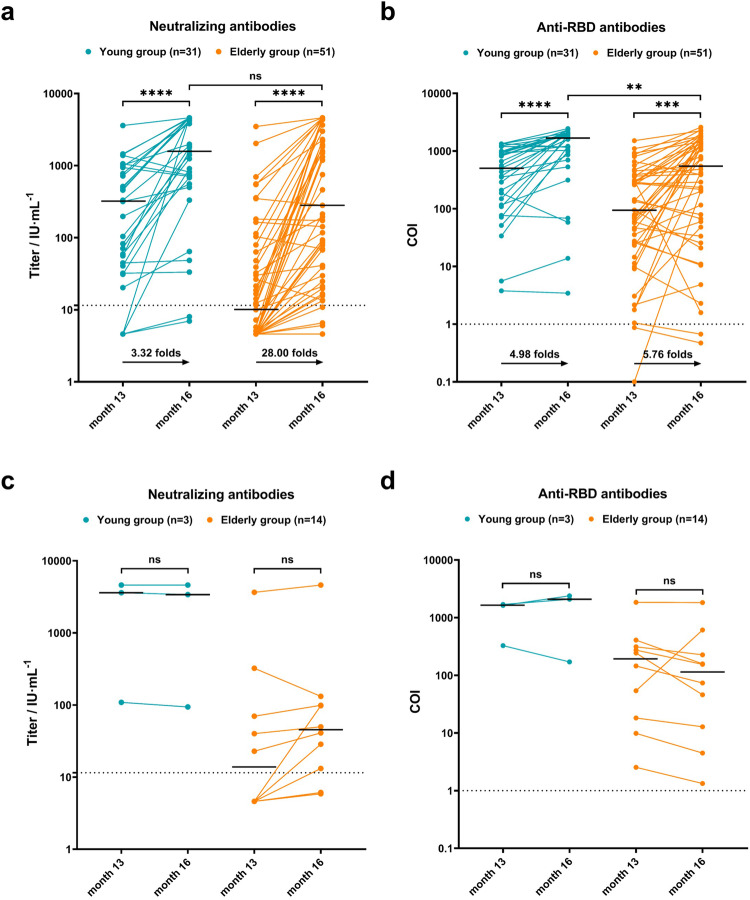
Fig. 5.
Analysis of changes in antibodies before and after infection. Changes in antibody levels were depicted in (a) and (b) for infected participants, and in (c) and (d) for uninfected participants. Data were analyzed using the Mann–Whitney U test. **P < 0.01, ***P < 0.001, ****P < 0.0001. ns no significance. Bold black horizontal lines represented the median values of antibody titers. Dot lines represented the threshold of antibodies

