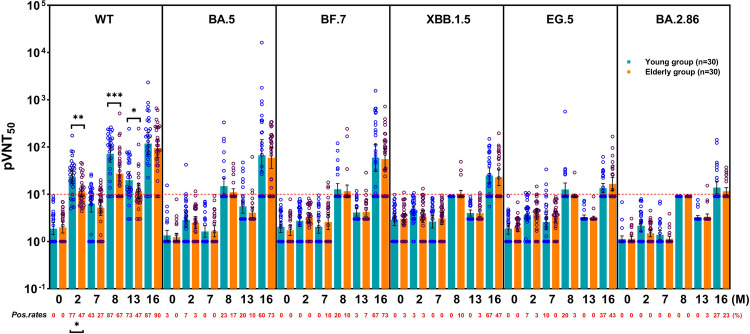
Fig. 6.
Positive rates and titers of different virus-specific neutralizing antibodies. Pseudovirus 50% neutralization titers (pVNT50) were detected in the two groups at baseline and 2, 7, 8, 13, and 16 months and are represented as geometric means in the column chart; the antibody-positive rates are indicated by the red number at the bottom of the figure. Only significant differences are marked with P values. The red dot line represents the antibody-positive threshold. Data were analyzed using the chi-square test and Mann–Whitney U test. *P < 0.05, **P < 0.01, ***P < 0.001. WT wild-type SARS-CoV-2 D614G; pos. rates positive rates

